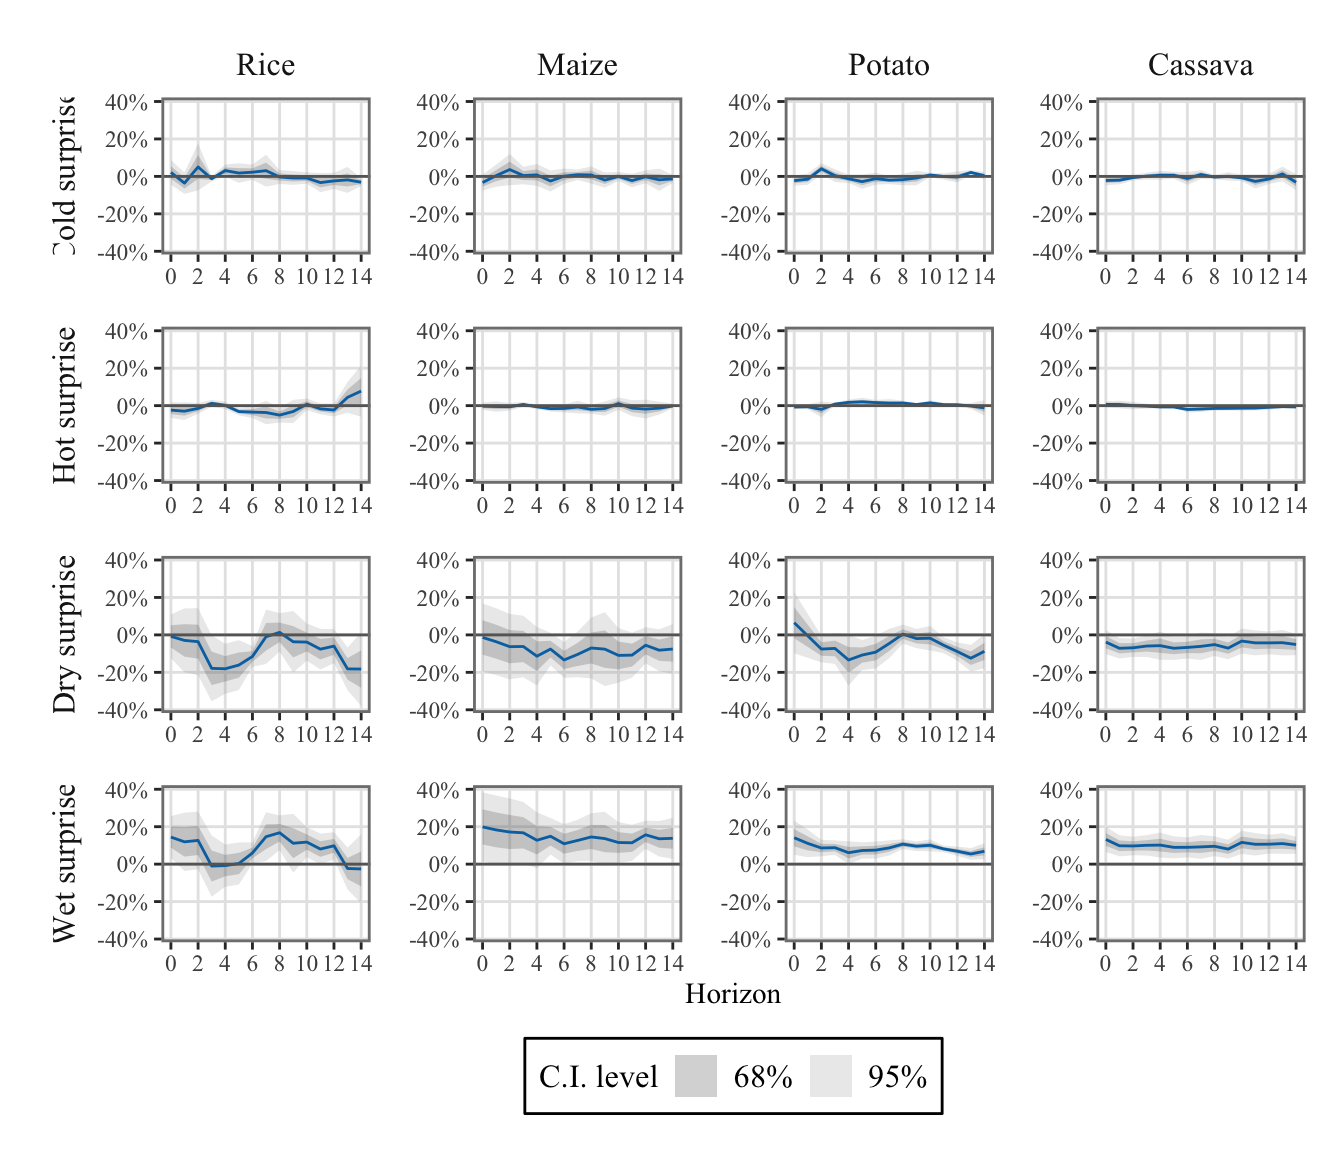
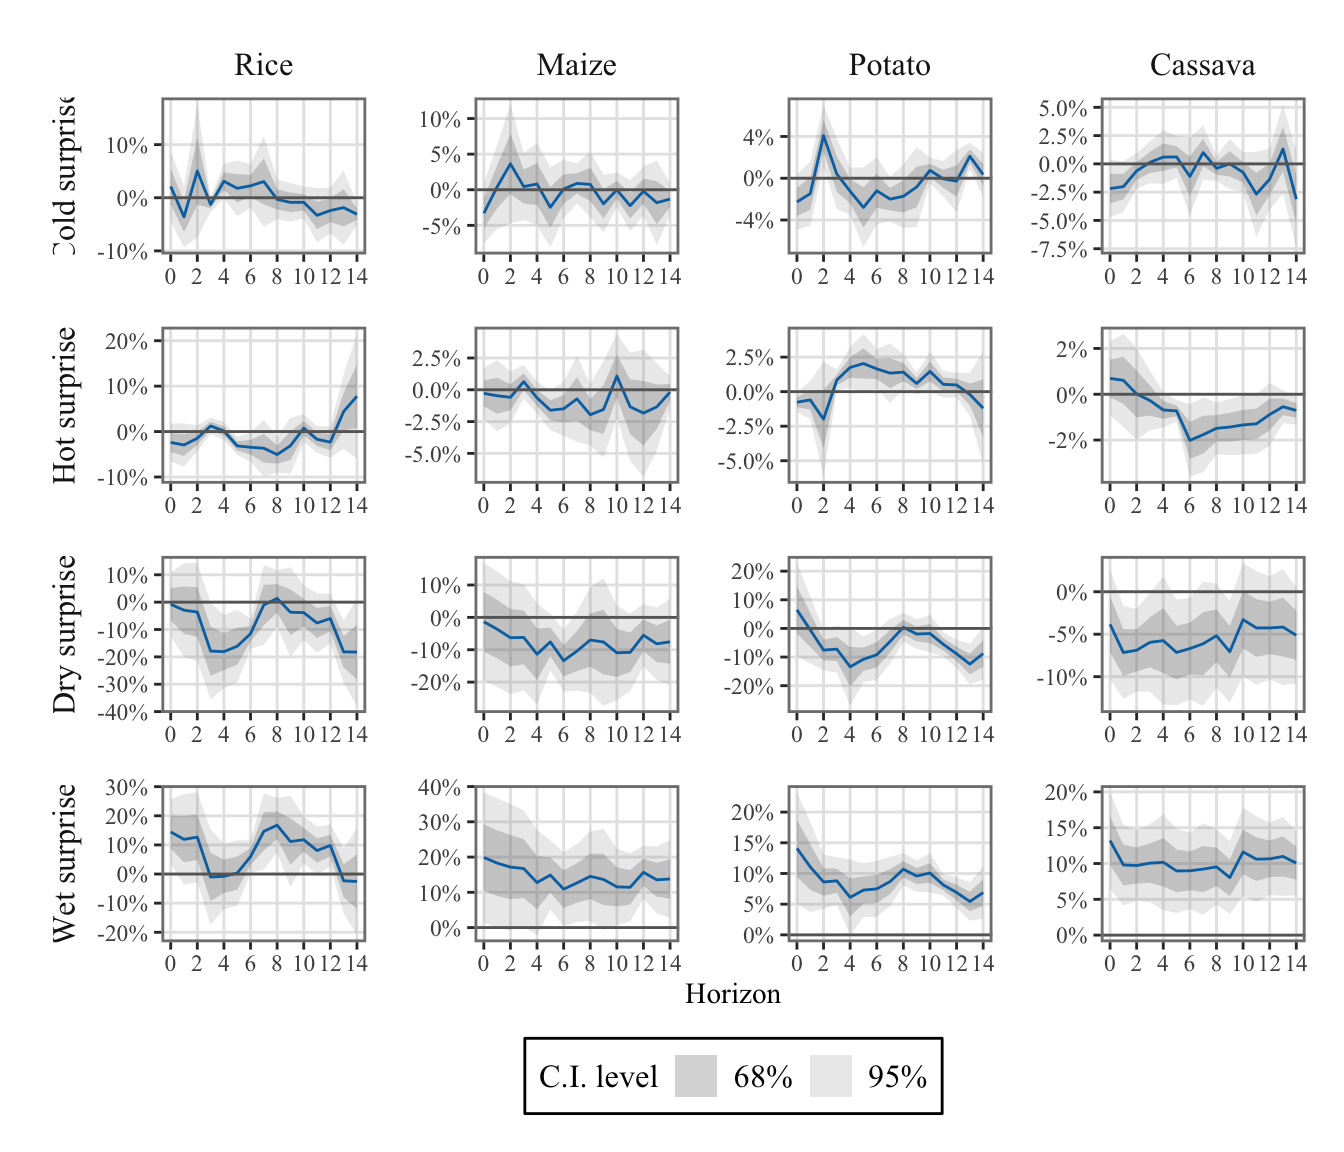
To differentiate the effects of positive and negative shocks, we defined two indicators for both temperature and precipitation: one for positive shocks and another for negative shocks (see Section 1.4.3).
The idea is to compare the realized temperatures (or precipitation) in a given month \(m\) of year \(y\) at location \(\ell\) with expected temperatures (precipitation) based on observations from the same month in previous years at the same location. The difference is defined as a surprise shock.
For days hotter (wetter) than expected, the shock in cell \(\ell\) is defined as: \[
\begin{align}
W^{(+)}_{\ell,y,m, c} = \underbrace{\sum_{d=1}^{n_m} \mathrm{1}(\mathcal{W}_{\ell,y,m,d} > \text{ut}_{\ell,y,m, c})}_{\text{Climate realization}} - \underbrace{\frac{1}{5}\sum_{k=1}^{5}\sum_{d=1}^{n_m} \mathrm{1}(\mathcal{W}_{\ell,y-k,m,d} > \text{ut}_{\ell,y,m, c})}_{\text{Expected realization}},
\end{align}
\] where \(\mathcal{W}_{\ell,y,m,d}\) is the daily average temperature (or total rainfall), \(n_m\) is the number of days in month \(m\), and \(\text{ut}^{\mathcal{w}}_{\ell,y,m, c}\) is the threshold for hot days for crop \(c\).
Similarly, cold (dry) shocks are defined as: \[
\begin{align}
W^{(-)}_{\ell,y,m,c} = \sum_{d=1}^{n_m} \mathrm{1}(\mathcal{W}_{\ell,y,m,d} < \text{lt}_{\ell,y,m, c}) - \frac{1}{5}\sum_{k=1}^{5}\sum_{d=1}^{n_m} \mathrm{1}(\mathcal{W}_{\ell,y-k,m,d} < \text{lt}_{\ell,y,m,c}),
\end{align}
\] where \(\text{lt}_{\ell,y,m,c}\) is the crop-specific threshold for cold days.
Thresholds \(\text{ut}_{\ell,y,m,c}\) and \(\text{lt}_{\ell,y,m,c}\) are based on the 90th and 10th percentiles of temperatures (precipitation) observed during month \(m\) over the past five years. The sample of past observation is denoted as \(\boldsymbol{W}_{\ell,y,d} = \left\{\{\mathcal{W}_{\ell,y-1,m,d}\}_{d=1}^{n_m}, \{\mathcal{W}_{c,y-2,m,d}\}_{d=1}^{n_m}, \ldots, \{\mathcal{W}_{c,y-5,m,d}\}_{d=1}^{n_m}\}\right\}\).
For temperature shocks, the thresholds are defined as follows: \[
\begin{align}
\text{ut}_{\ell,y,m,c} &= \max\{P_{90}(\boldsymbol{T}_{\ell,y,d}), \tau_{\text{upper},c}\}\\
\text{lt}_{\ell,y,m,c} &= \min\{P_{10}(\boldsymbol{T}_{\ell,y,d}), \tau_{\text{lower}},c\}
\end{align}
\] with \(\tau_{\text{upper},c} = 29^\circ\text{C}\) for rice and maize, \(30^\circ\text{C}\) for potatoes and cassava, and \(\tau_{\text{lower},c} = 8^\circ\text{C}\) for rice and maize, \(10^\circ\text{C}\) for potatoes and cassava.
For precipitation shocks, the thresholds are defined using the percentiles of past values only:% \[
\begin{align}
\text{ut}_{\ell,y,m,c} &= P_{90}(\boldsymbol{P}_{\ell,y,d})\\
\text{lt}_{\ell,y,m,c} &= P_{10}(\boldsymbol{P}_{\ell,y,d})
\end{align}
\]
Positive values of \(\mathcal{W}^{(+)}_{\ell,y,m,c}\) represent days that are hotter (or wetter) than expected, while positive values of \(\mathcal{W}^{(-)}_{\ell,y,m,c}\) represent days that are colder (or drier) than expected.
The values were aggregated at the monthly regional level (see Chapter 1).

