10  Descriptive Statistics

Let us load:

Let us first load {tidyverse}:

library(tidyverse)
── Attaching core tidyverse packages ──────────────────────── tidyverse 2.0.0 ──
✔ dplyr     1.1.4     ✔ readr     2.1.5
✔ forcats   1.0.0     ✔ stringr   1.5.1
✔ ggplot2   3.5.1     ✔ tibble    3.2.1
✔ lubridate 1.9.3     ✔ tidyr     1.3.1
✔ purrr     1.0.2     
── Conflicts ────────────────────────────────────────── tidyverse_conflicts() ──
✖ dplyr::filter() masks stats::filter()
✖ dplyr::lag()    masks stats::lag()
ℹ Use the conflicted package (<http://conflicted.r-lib.org/>) to force all conflicts to become errors

The raw data:

load("../data/df_merged.rda")
dim(df)
[1] 18561   841

Then the cleaned data:

load("../data/df_clean_mhi3.rda")
dim(df_clean)
[1] 5293   94

Let us add a variable in df stating whether or not the observation is included in the final sample:

df <- df |> 
  mutate(in_sample = id %in% df_clean$id)

Sanity check:

table(df$in_sample)

FALSE  TRUE 
13268  5293 

Let us get the name of each variable, as defined in [Chapter -Chapter 2)

load("../data/out/variable_names.rda")

Let us change the Not reported and Not surveyed variables to No answer:

df <- 
  df |> 
  mutate(
    across(
      .cols = is.factor,
      .fns = function(x) {
        fct_recode(x,
                   "No answer" = "Not reported",
                   "No answer" = "Not surveyed"
        )
      }
    )
  )

10.1 MHI-Scores

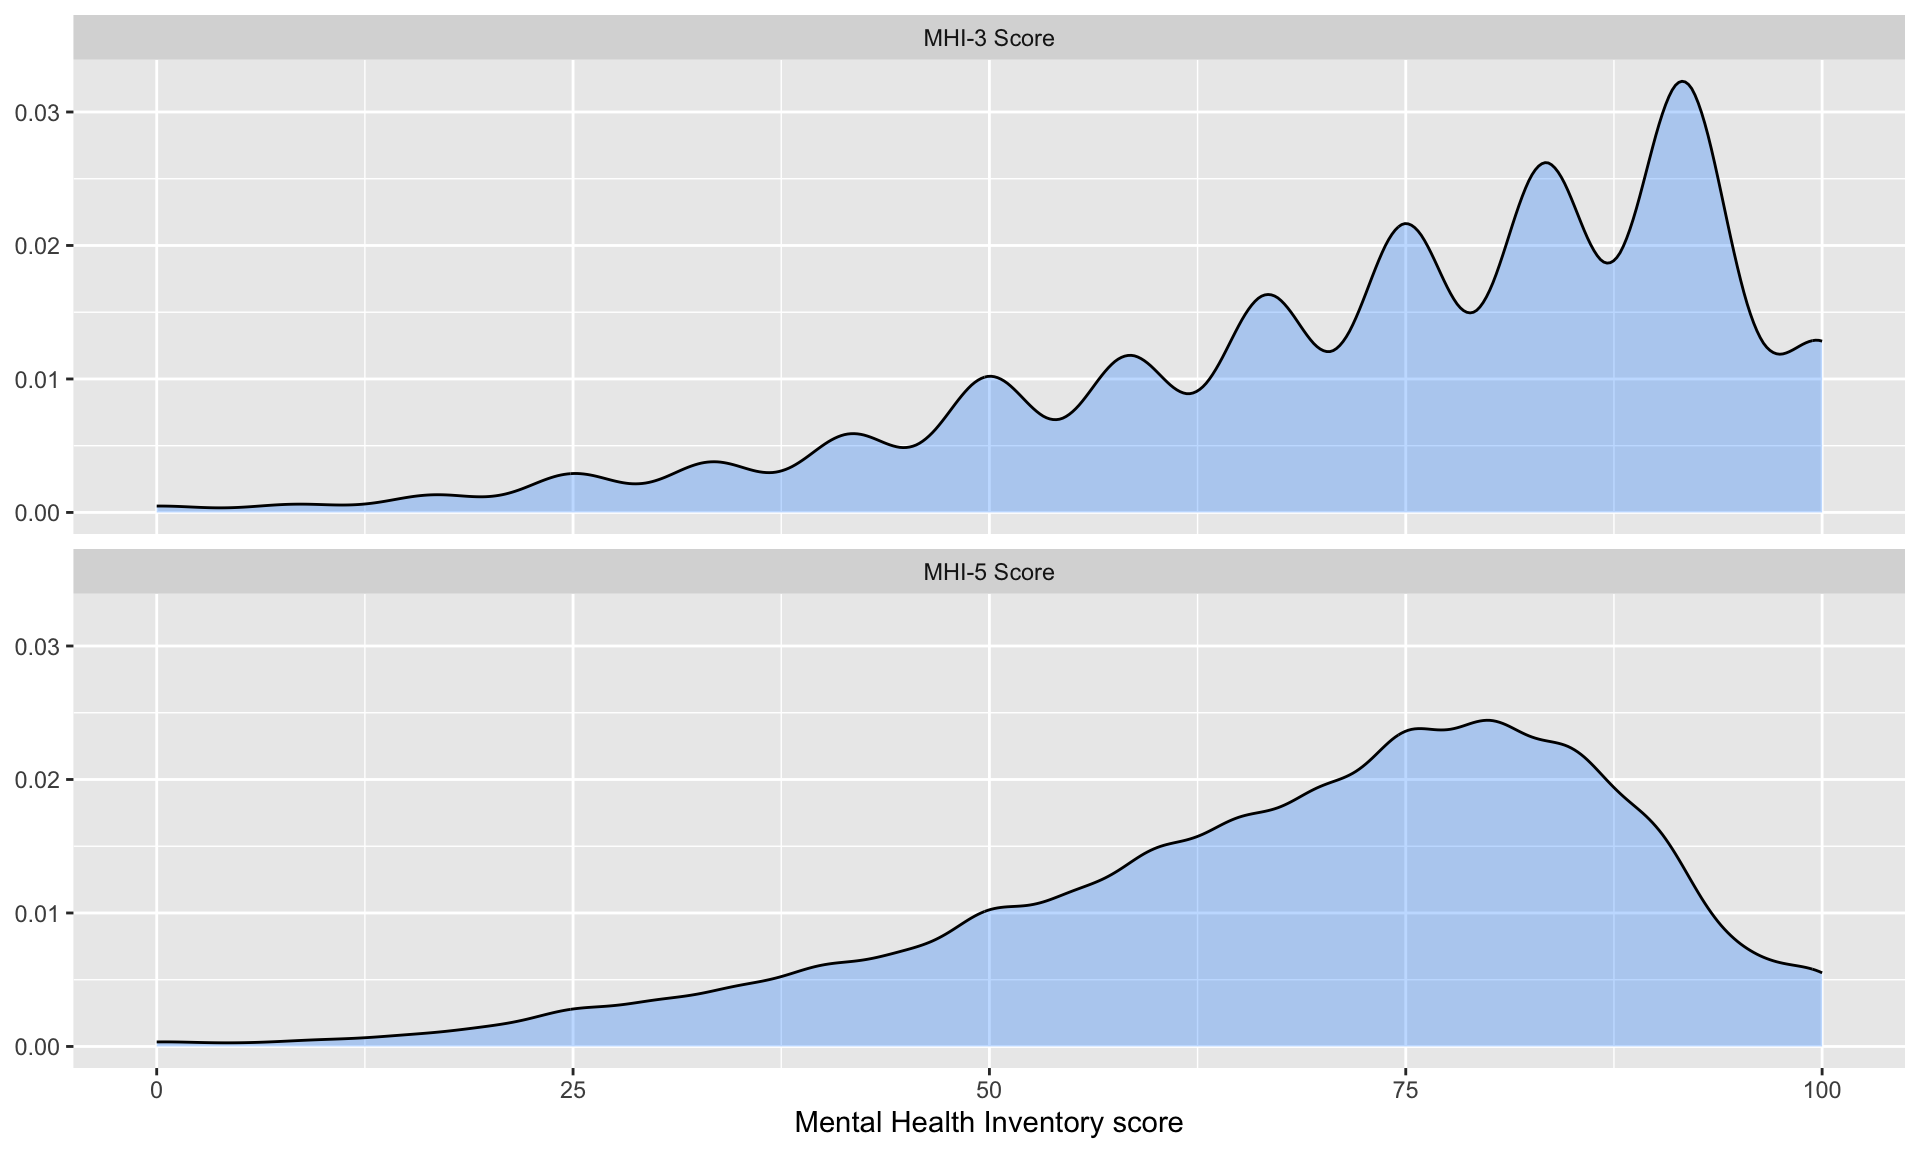
We can first look at the distribution of the MHI-5 and MHI-3 scores over the entire dataset. Due to the construction of the MHI scores, one notes relatively high masses for multiples of 5. The distribution of MHI scores is skewed on the right both for MHI-3 and MHI-5.

df |> 
  group_by(PERSONNE_pb_depress) |> 
  summarise(
    mhi_5_mean = mean(score_t_corrected, na.rm=T),
    mhi_5_sd = sd(score_t_corrected, na.rm=T),
    n = n()
  )
# A tibble: 3 × 4
  PERSONNE_pb_depress mhi_5_mean mhi_5_sd     n
  <fct>                    <dbl>    <dbl> <int>
1 No depression             70.7     17.4 11860
2 Depression                41.2     19.1   705
3 No answer                 70.1     17.5  5996
Show the codes to create the graph
ggplot(
  data = df |> 
  select(PERSONNE_score_t_corrected, score_mhi_3) |> 
  rename(
    "MHI-5 Score" = PERSONNE_score_t_corrected,
    "MHI-3 Score" = score_mhi_3
  ) |> 
  gather(score, value, `MHI-5 Score`, `MHI-3 Score`), 
  mapping = aes(x = value)
  ) +
  geom_density(alpha = .3, fill = "dodger blue") +
  labs(
    x = "Mental Health Inventory score", y = NULL
  ) +
  facet_wrap(~score, ncol = 1) +
  theme(
    plot.title.position = "plot",
    plot.title = element_text(hjust = 0, size = rel(1.3), face = "bold")
  )
Warning: Removed 12376 rows containing non-finite outside the scale range
(`stat_density()`).
Figure 10.1: Density of MHI-5 and MHI-3 scores
Show the codes to create the graph
ggplot(data = df |> 
  filter(in_sample) |> 
  select(PERSONNE_score_t_corrected, score_mhi_3) |> 
  rename("MHI-5 Score" = PERSONNE_score_t_corrected, "MHI-3 Score" = score_mhi_3) |> 
  gather(score, value, `MHI-5 Score`, `MHI-3 Score`), 
  mapping = aes(x = value)
) +
  geom_density(alpha = .3, fill = "dodger blue") +
  labs(
    x = "Mental Health Inventory score", y = NULL) +
  facet_wrap(~score, ncol = 1)
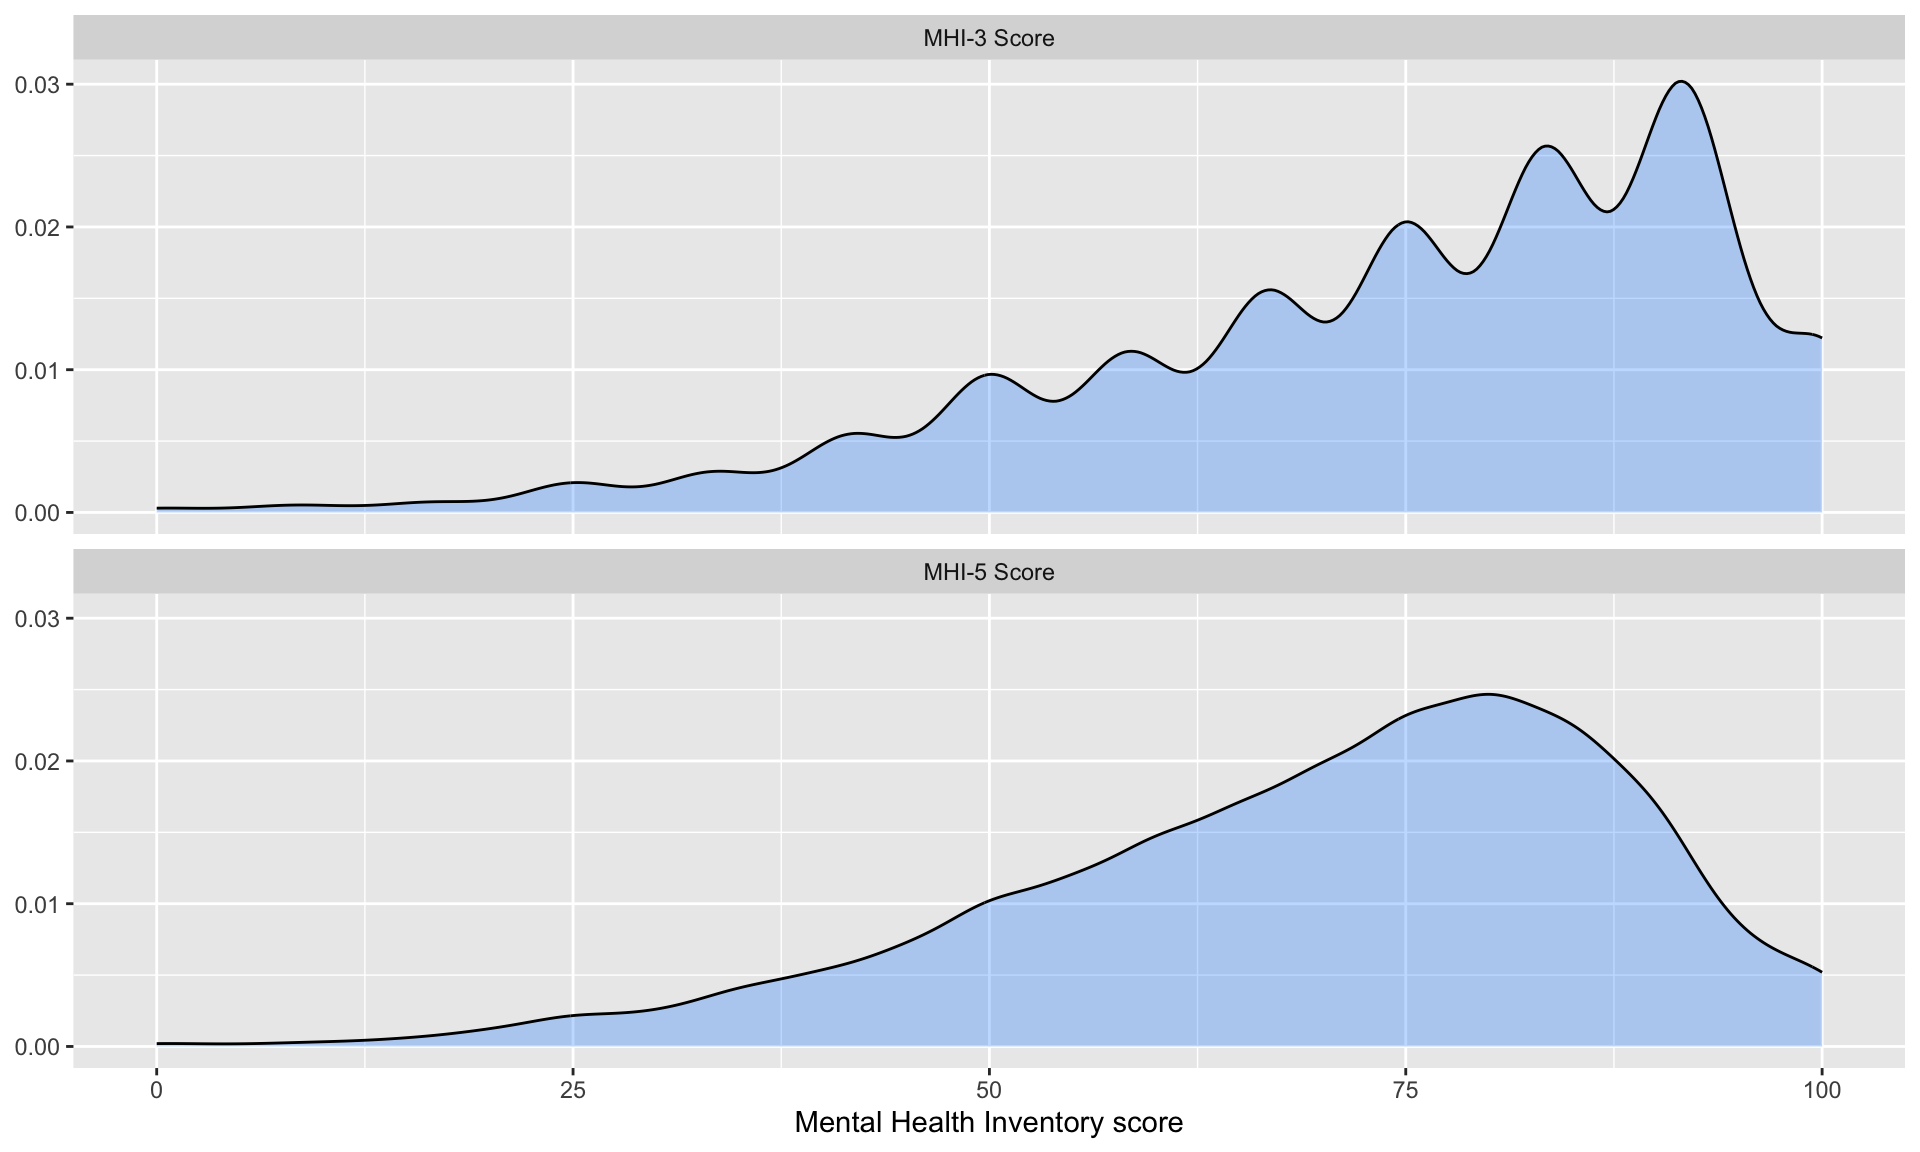
Figure 10.2: Density of MHI-5 and MHI-3 scores

Respondents to the ESPS survey answered the following question: “In the past 12 months, have you experienced depression?” (“Au cours des 12 derniers mois, avez-vous eu une dépression?”).

The responses are distributed as follows:

# Counts
table(df$PERSONNE_pb_depress)

No depression    Depression     No answer 
        11860           705          5996 
# Proportions
prop.table(table(df$PERSONNE_pb_depress)) |> round(2)

No depression    Depression     No answer 
         0.64          0.04          0.32 
Note

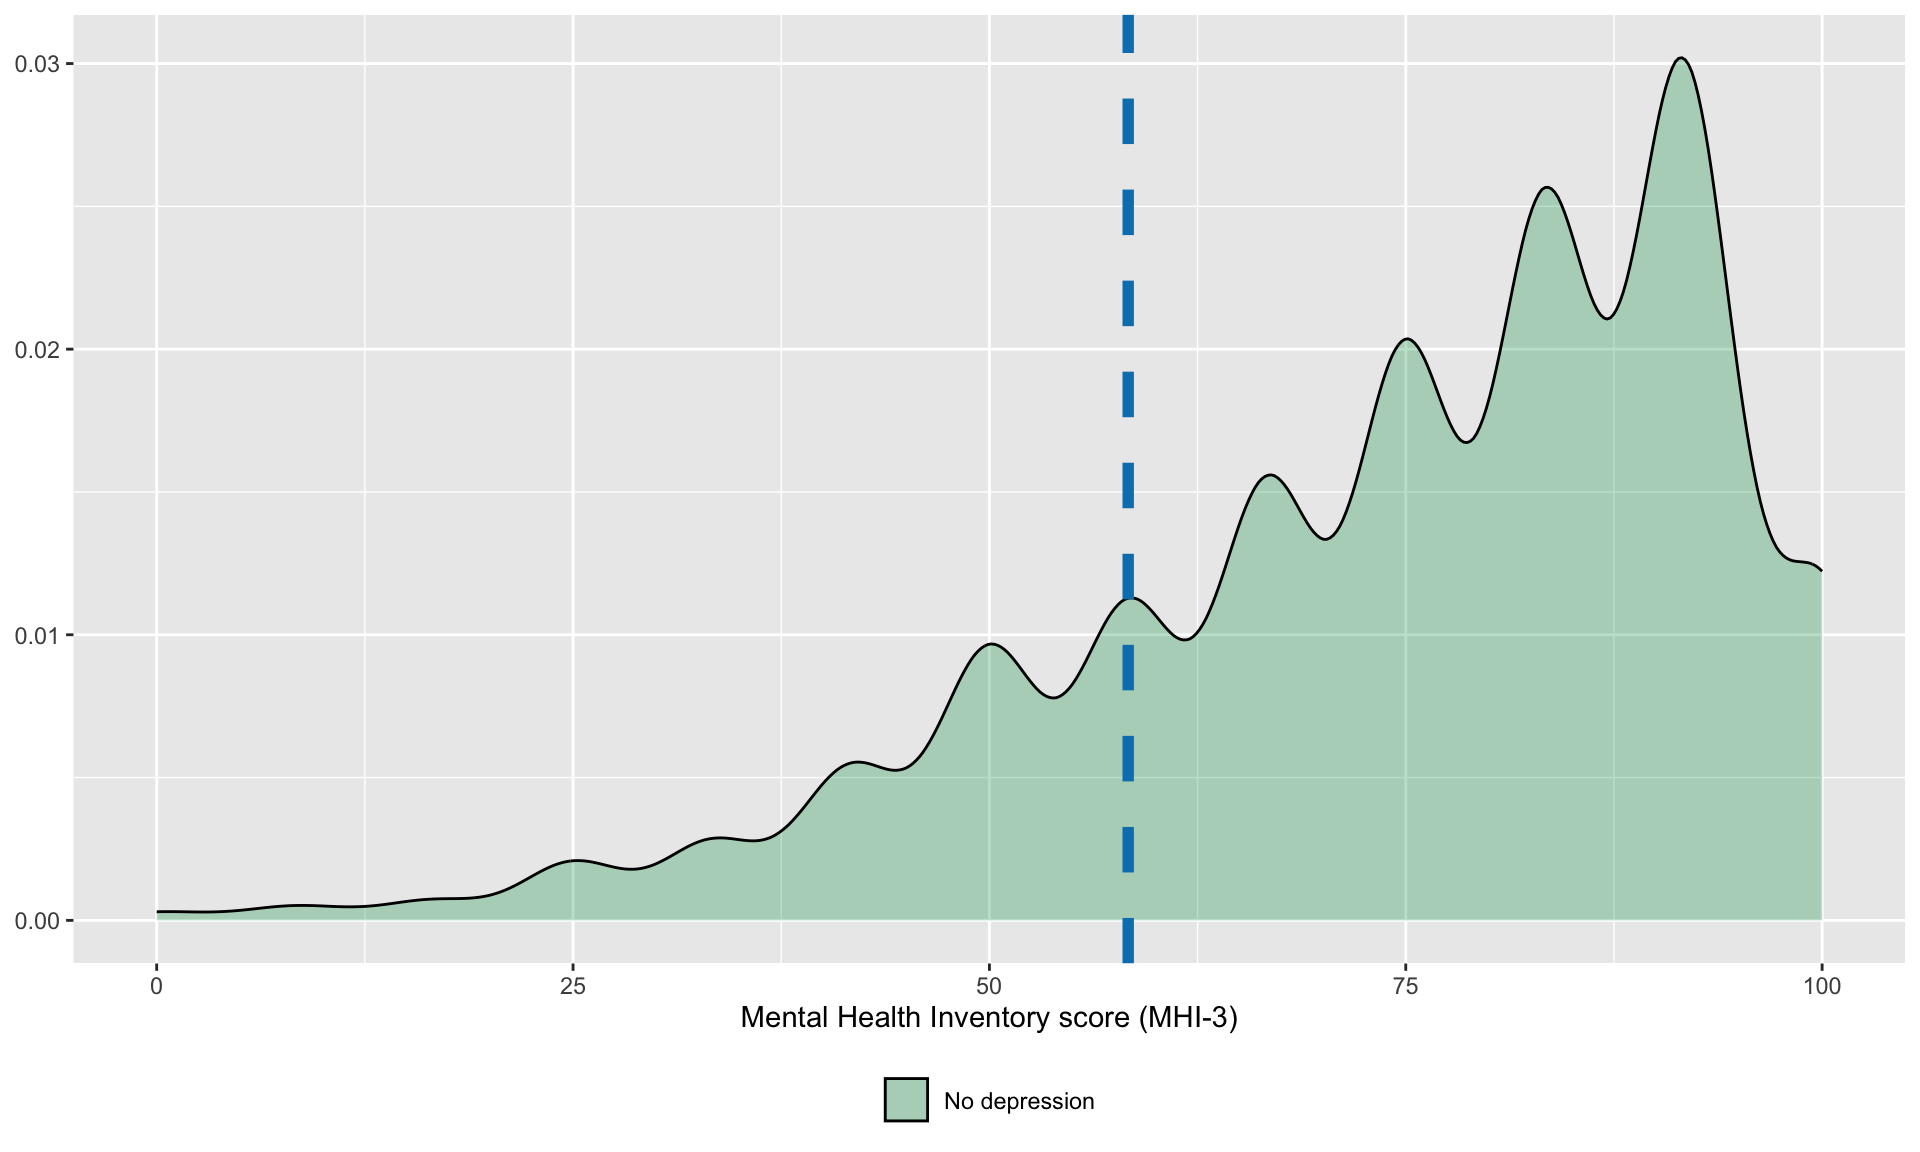
Recall that in the sample used, we focus on individuals who reported not having experienced depression during the past 12 months.

# Counts
df |> 
  filter(in_sample) |>
  pull(PERSONNE_pb_depress) |> 
  table()

No depression    Depression     No answer 
         5293             0             0 
# Proportions
df |> 
  filter(in_sample) |>
  pull(PERSONNE_pb_depress) |> 
  table() |> 
  prop.table() |> 
  round(digits = 2)

No depression    Depression     No answer 
            1             0             0 

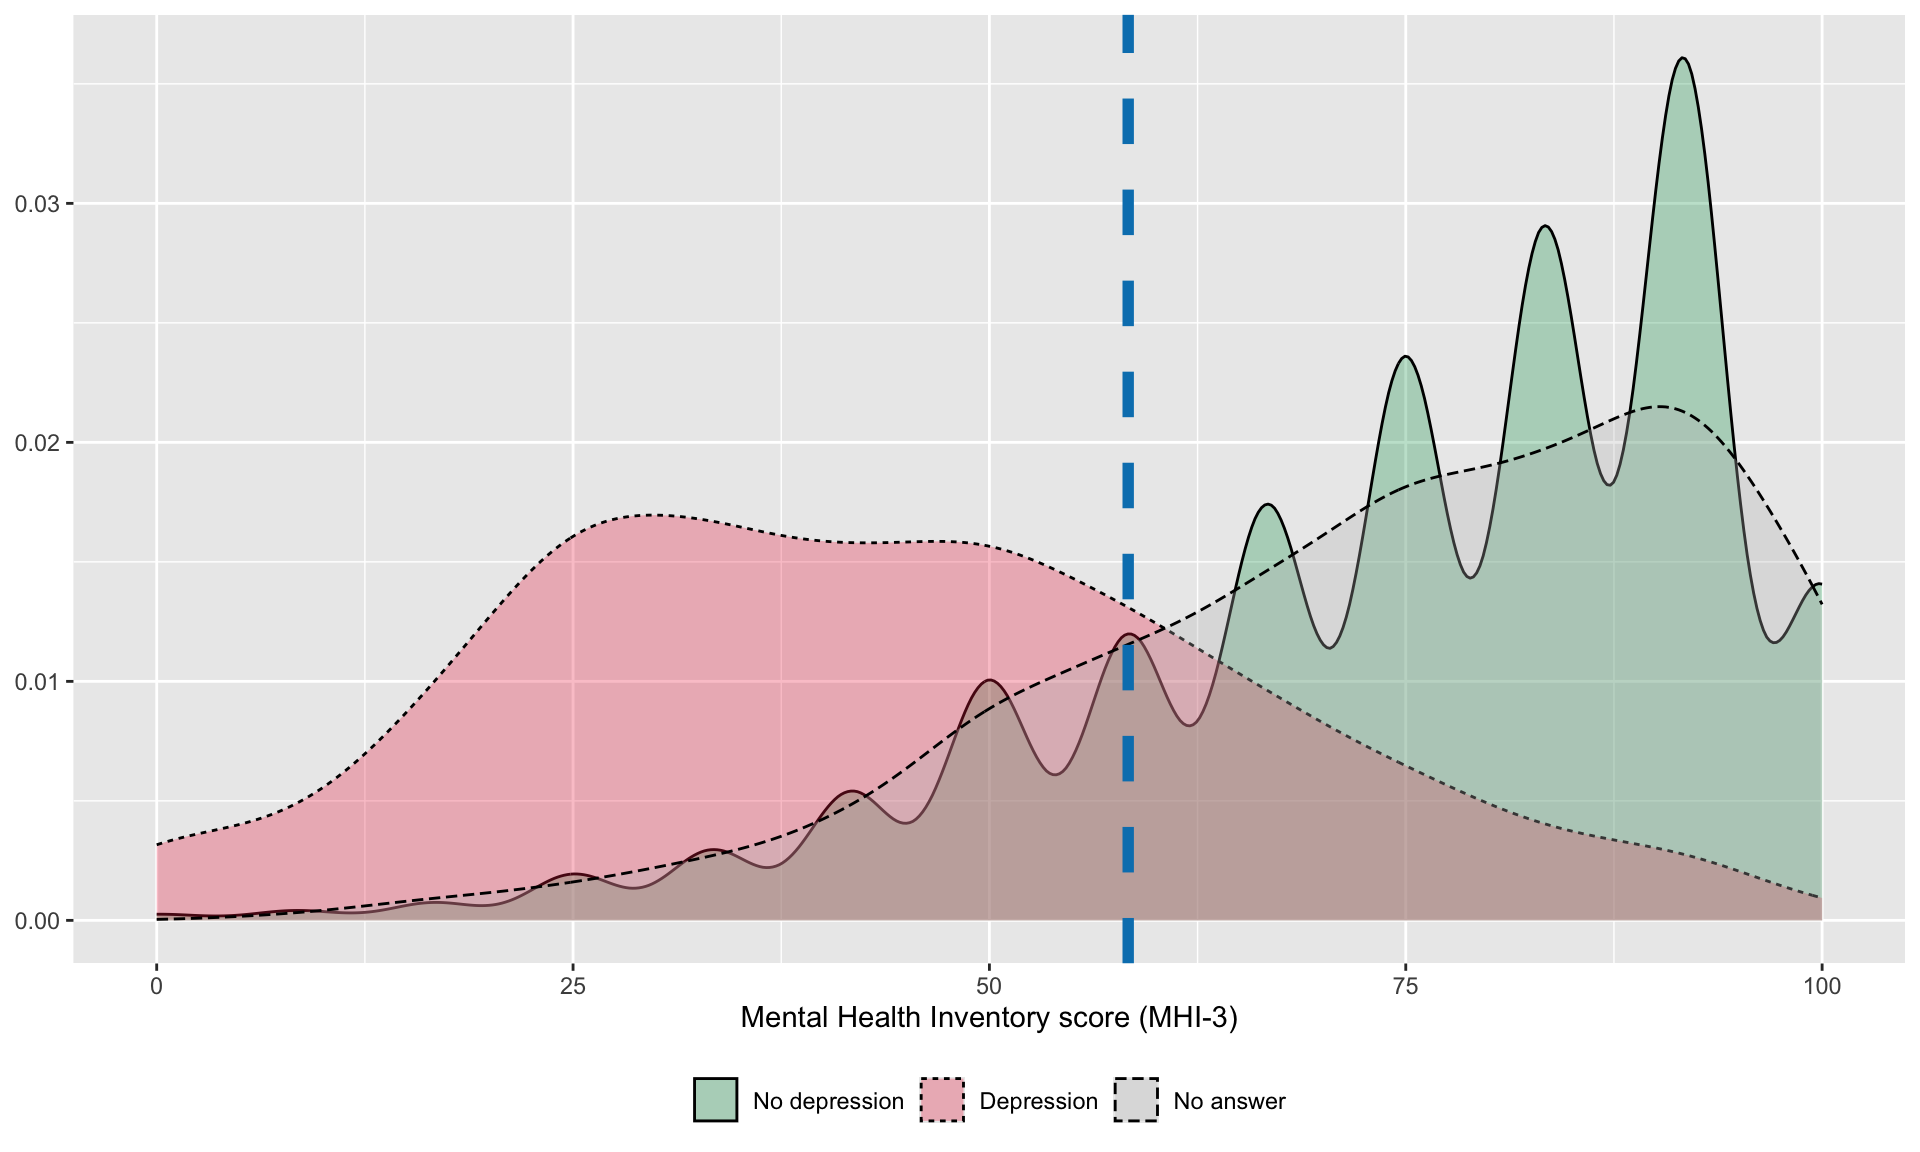
Let us examine the distribution of the MHI-3 score by grouping individuals according to their response to the question regarding depression. Let us add a vertical dashed line on the graph corresponding to the first quartile of the overall distribution of MHI-3 scores.

Show the codes to create the graph
p_distrib_mhi_3 <- ggplot(
    data = df,
    mapping = aes(x = score_mhi_3)
  ) +
  geom_density(
    mapping = aes(fill = PERSONNE_pb_depress, linetype = PERSONNE_pb_depress), 
    alpha = .3
  ) +
  geom_vline(
    xintercept = quantile(
      df$score_mhi_3,
      probs = .25, 
      na.rm = TRUE
    ),
    colour = "#0081BC", linetype = "dashed", linewidth = 2
  ) +
  labs(x = "Mental Health Inventory score (MHI-3)", y = NULL) +
  scale_fill_manual(
    NULL,
    values = c(
      "No depression" = "#009D57",
      "Depression" = "#EE324E",
      "No answer" = "grey"
    )
  ) +
  scale_linetype_discrete(NULL) +
  theme(legend.position = "bottom")

p_distrib_mhi_3
Warning: Removed 6188 rows containing non-finite outside the scale range
(`stat_density()`).
Figure 10.3: Density of MHI-3 scores
Show the codes to create the graph
p_distrib_mhi_3 <- 
  ggplot(
    data = df |> 
  filter(in_sample),
  mapping = aes(x = score_mhi_3)
  ) +
  geom_density(
    mapping = aes(fill = PERSONNE_pb_depress, linetype = PERSONNE_pb_depress), 
    alpha = .3
  ) +
  geom_vline(
    xintercept = quantile(
      df$score_mhi_3, probs = .25, 
      na.rm = TRUE
    ),
    colour = "#0081BC", linetype = "dashed", size = 2
  ) +
  labs(x = "Mental Health Inventory score (MHI-3)", y = NULL) +
  scale_fill_manual(
    NULL, 
    values = c(
      "No depression" = "#009D57",
      "Depression" = "#EE324E",
      "No answer" = "grey"
    )
  ) +
  scale_linetype_discrete(NULL) +
  theme(legend.position = "bottom")
Warning: Using `size` aesthetic for lines was deprecated in ggplot2 3.4.0.
ℹ Please use `linewidth` instead.
Show the codes to create the graph
p_distrib_mhi_3
Figure 10.4: Density of MHI-3 scores

Recall that we used the first quartile as the threshold for the classification of individuals as either “low” MHI score or “high” MHI score. The first quantile is:

quant <- .25
q1_mhi_3 <- quantile(df$score_mhi_3, probs = quant, na.rm=TRUE)
q1_mhi_3
     25% 
58.33333 

We decided to remove from the dataset the individuals who did not answer the question regarding depression, leaving us with the following distribution:

tableau_size <- 
  df |> 
  filter(PERSONNE_age >= 15) |> 
  filter(!is.na(score_mhi_3)) |> 
  filter(PERSONNE_pb_depress != "No answer") |> 
  mutate(
    PERSONNE_pb_depress = factor(
      PERSONNE_pb_depress, levels = c("Depression", "No depression")
    )
  ) |> 
  mutate(inf_q1 = score_mhi_3 <= q1_mhi_3) |> 
  mutate(
    inf_q1 = factor(inf_q1, levels = c(T,F), 
                    labels = c("MHI-3 <= Q1", "MHI-3 > Q1")
    )
  ) |> 
  ungroup()

tableau_size_2 <- table(tableau_size$inf_q1, tableau_size$PERSONNE_pb_depress)
(tableau_size_2_margins <- addmargins(tableau_size_2))
             
              Depression No depression   Sum
  MHI-3 <= Q1        542          2439  2981
  MHI-3 > Q1         131          8760  8891
  Sum                673         11199 11872
round(prop.table(tableau_size_2) * 100, 1)
             
              Depression No depression
  MHI-3 <= Q1        4.6          20.5
  MHI-3 > Q1         1.1          73.8
tableau_size_sample <- 
  df |> 
  filter(in_sample) |> 
  filter(!is.na(score_mhi_3)) |> 
  filter(PERSONNE_pb_depress != "No answer") |> 
  mutate(
    PERSONNE_pb_depress = factor(
      PERSONNE_pb_depress, 
      levels = c("Depression", "No depression")
    )
  ) |> 
  mutate(inf_q1 = score_mhi_3 <= q1_mhi_3) |> 
  mutate(
    inf_q1 = factor(
      inf_q1, levels = c(T,F), 
      labels = c("MHI-3 <= Q1", "MHI-3 > Q1")
    )
  )|> 
  ungroup()

tableau_size_sample_2 <- table(tableau_size_sample$inf_q1, tableau_size_sample$PERSONNE_pb_depress)
(tableau_size_sample_2_margins <- addmargins(tableau_size_sample_2))
             
              Depression No depression  Sum
  MHI-3 <= Q1          0          1262 1262
  MHI-3 > Q1           0          4031 4031
  Sum                  0          5293 5293
round(prop.table(tableau_size_sample_2) * 100, 1)
             
              Depression No depression
  MHI-3 <= Q1        0.0          23.8
  MHI-3 > Q1         0.0          76.2

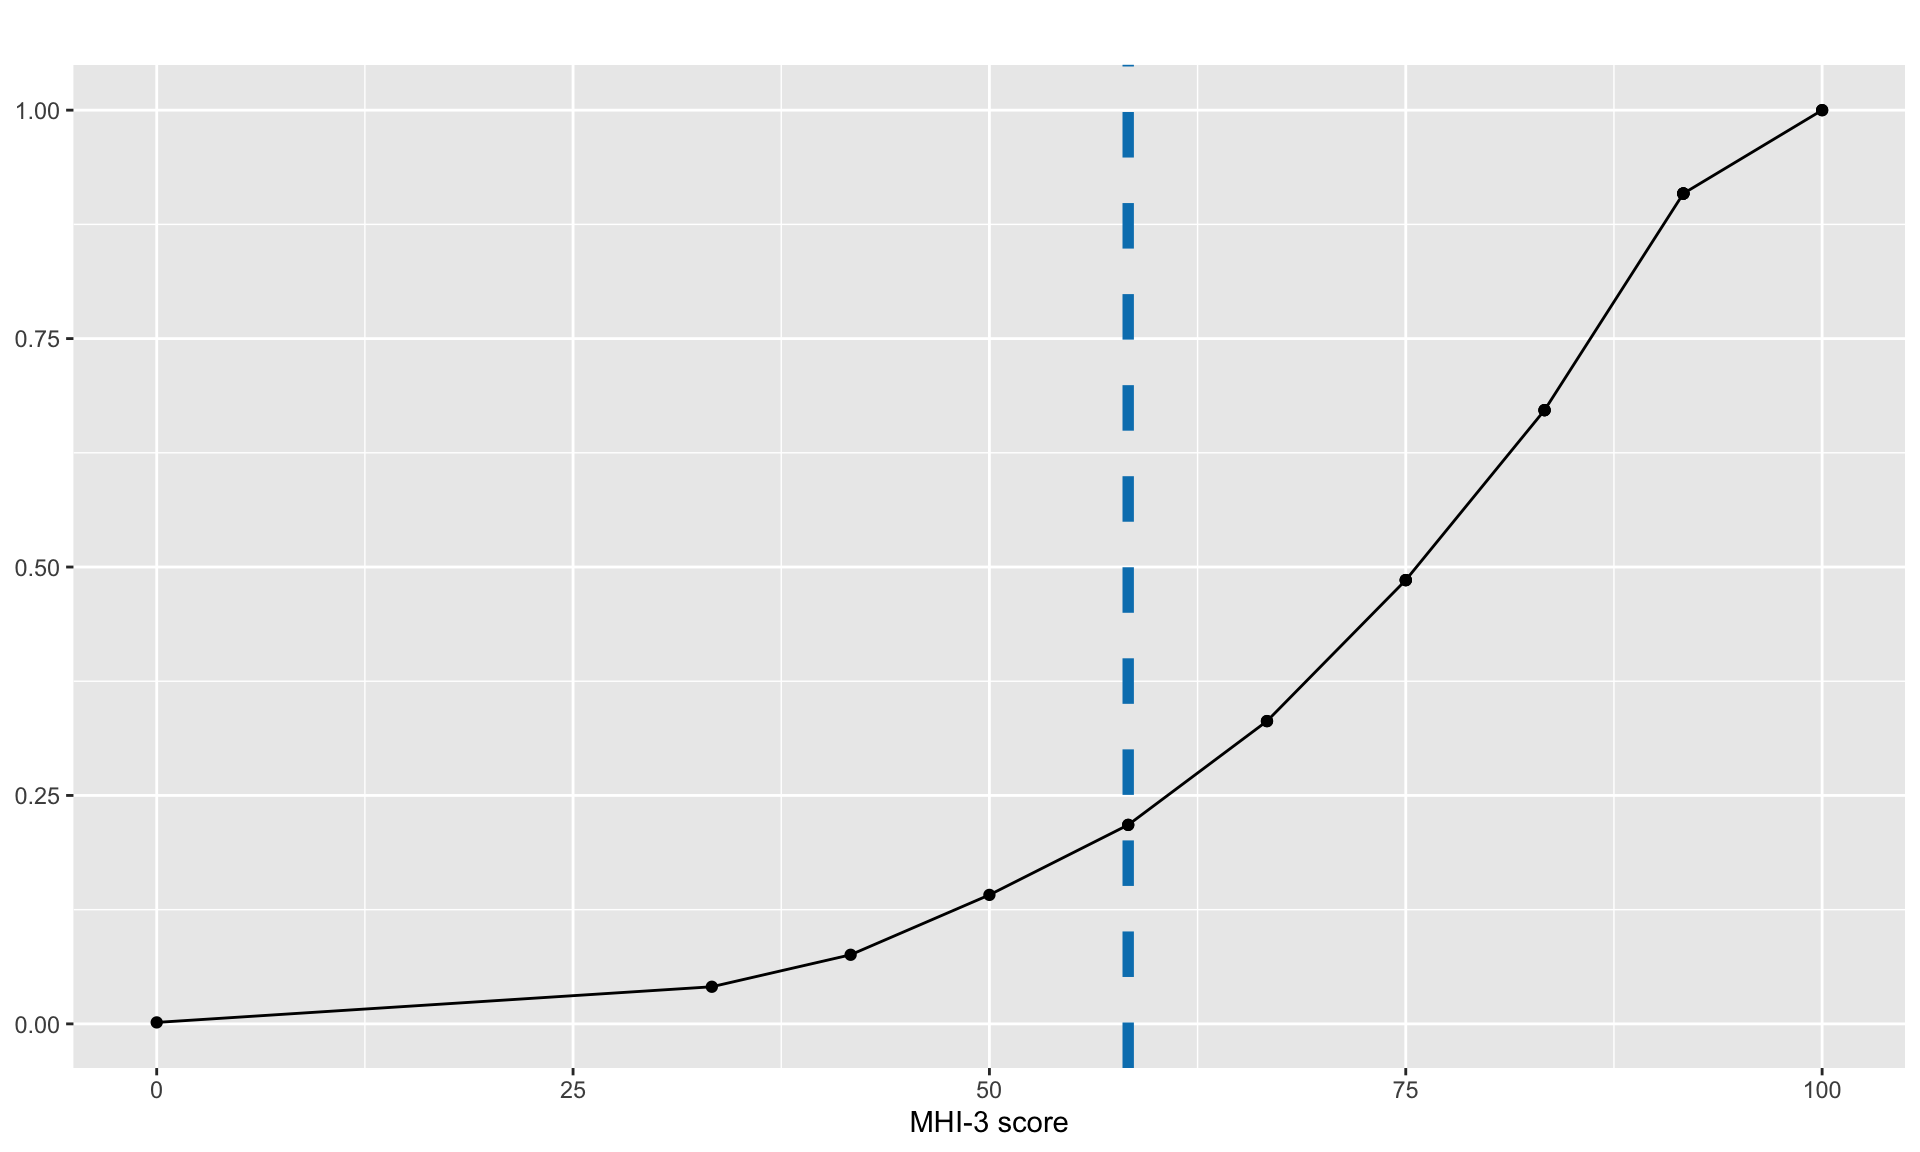
In the study, we decided to use the first quartile of the distribution of MHI-3 scores to classify individuals as depressed (when their MHI-3 score is less than or equal to the first quartile of the distribution) or non-depressed (when their MHI-3 score is greater than the first quartile of the distribution). It is possible to illustrates the impact of this choice on the proportion of individuals designated as depressed with respect to the MHI-3 score. To that end, we can first create a function that computes the proportion of people classified as depressive depending on the selected threshold.

get_prop <- function(prob, df) {
  q1_mhi_3 <- quantile(df$score_mhi_3, probs = prob, na.rm=TRUE)
  tableau <- df |> 
    filter(!is.na(PERSONNE_score_t_corrected)) |> 
    filter(PERSONNE_pb_depress != "No answer") |> 
    mutate(inf_q1 = score_mhi_3 <= q1_mhi_3) |> 
    group_by(PERSONNE_pb_depress) |> 
    summarise(
      inf_q1 = sum(inf_q1),
      sup_q1 = n() - inf_q1,
      tot = n()
    ) |> 
    mutate(inf_q1_prop = inf_q1 / (inf_q1 + sup_q1),
           inf_q1_prop = round(inf_q1_prop * 100, 2))
  
  nb_inf_q1 <- tableau |> filter(PERSONNE_pb_depress == "No depression") |> 
    pull(inf_q1)
  
  nb_sup_q1 <- tableau |> filter(PERSONNE_pb_depress == "No depression") |> 
    pull(sup_q1)
  
  
  nb_obs_depression <- tableau |> 
    filter(PERSONNE_pb_depress == "No depression") |> 
    pull(tot)
  
  tibble(
    prob = prob, 
    cutoff = q1_mhi_3, 
    prop_no_depression_inf = nb_inf_q1 / nb_obs_depression
  )
}

This function can be applied to a sequence of thresholds, ranging from 0 to 1:

prop_no_depression_inf <- map_dfr(
  .x = seq(0, 1, by = .05), .f = get_prop, df = df
)

We can plot the proportion of people classified as drepressive as a function of the threshold used on the MHI-5 score. We have added a vertical blue dashed line to show the threshold used, i.e., the first quartile of the MHI-5 score distribution.

Show the codes to create the graph
p_imaginary_healtyh <- 
  ggplot(
    data = prop_no_depression_inf, 
    mapping = aes(x = cutoff, y = prop_no_depression_inf)
  ) +
  geom_line() +
  geom_point() +
  geom_vline(
    xintercept = q1_mhi_3, colour = "#0081BC", linetype = "dashed", size = 2
  ) +
  labs(
    x = "MHI-3 score", y = NULL,
       title = ""
    ) +
  theme(plot.title.position = "plot",
        plot.title = element_text(hjust = 0, size = rel(1.3), face = "bold"))

p_imaginary_healtyh
Figure 10.5: Proportion of individuals classified as depressive depending on MHI-3 score
Show the codes to create the graph
p_distrib_ages <- 
  ggplot(
    data = df |> 
  filter(
    PERSONNE_pb_depress %in% c("Depression", "No depression"),
    !is.na(inf_q1_mhi_3)
  ) |> 
  mutate(
    PERSONNE_pb_depress = factor(
      PERSONNE_pb_depress,
      levels = c("Depression", "No depression")
    )
  ) |> 
  mutate(
    inf_q1_mhi_3 = factor(
      as.character(inf_q1_mhi_3),
      levels = c("<=Q1", ">Q1"),
      labels = c("MHI-3 <= Q1", "MHI-3 >Q1")
    )
  ),
  mapping = aes(x = PERSONNE_age)
  ) +
  geom_density(aes(fill = inf_q1_mhi_3), alpha = .5) +
  labs(x = "Age", y = NULL) +
  scale_fill_manual(
    NULL, values = c(
      "MHI-3 >Q1" = "#009D57",
      "MHI-3 <= Q1" = "#EE324E"
    )
  ) +
  facet_grid(inf_q1_mhi_3 ~ PERSONNE_pb_depress) +
  theme(legend.position = "bottom")
p_distrib_ages
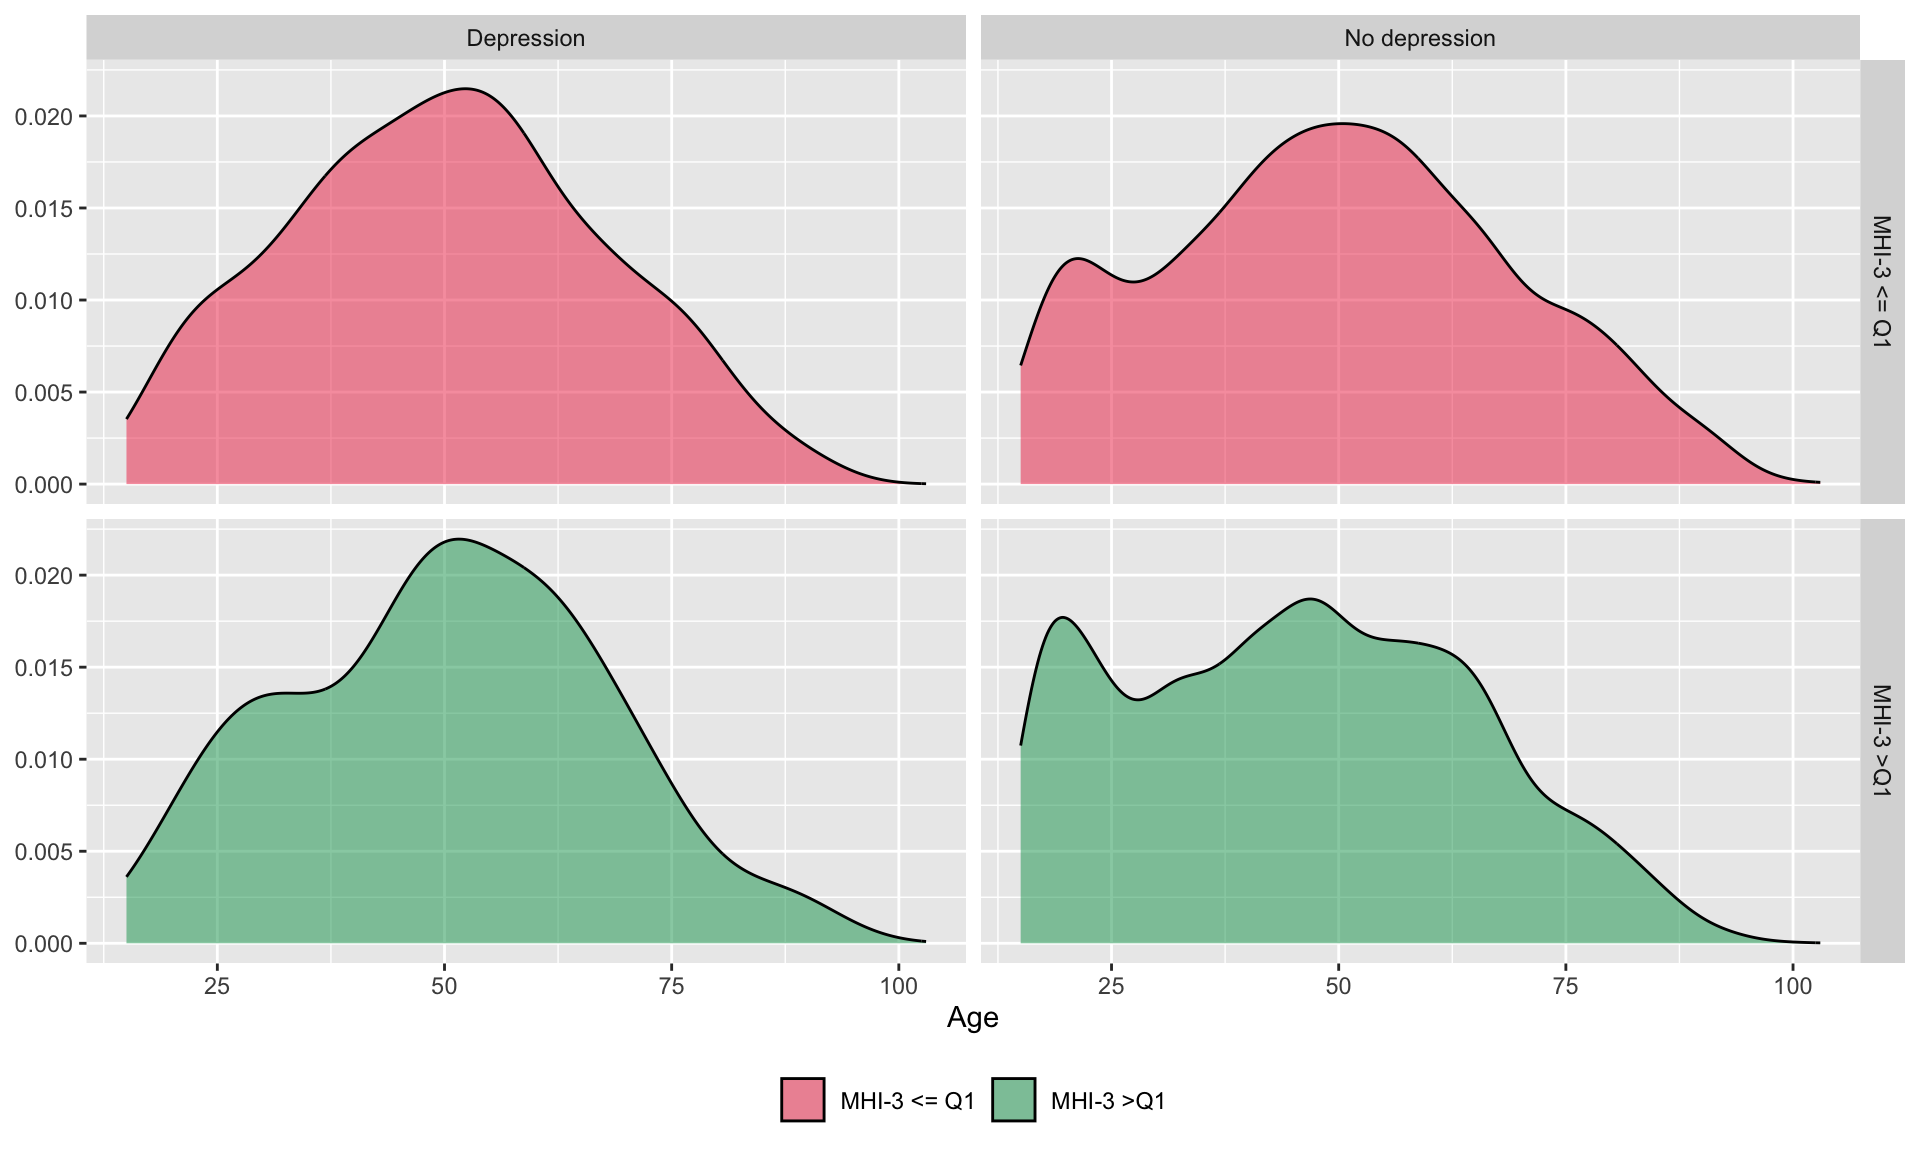
Figure 10.6: Density of age of individuals in each category
Show the codes to create the graph
p_distrib_ages_2 <- 
  ggplot(
    data = df |> 
      filter(in_sample) |> 
      filter(
        PERSONNE_pb_depress %in% c("Depression", "No depression"),
        !is.na(inf_q1_mhi_3)
      ) |> 
      mutate(
        PERSONNE_pb_depress = factor(
          PERSONNE_pb_depress,
          levels = c("Depression", "No depression")
        )
      ) |> 
      mutate(
        inf_q1_mhi_3 = factor(
          as.character(inf_q1_mhi_3),
          levels = c("<=Q1", ">Q1"),
          labels = c("MHI-3 <= Q1", "MHI-3 >Q1")
        )
      ),
    mapping = aes(x = PERSONNE_age)
  ) +
  geom_density(aes(fill = inf_q1_mhi_3), alpha = .5) +
  labs(x = "Age", y = NULL) +
  scale_fill_manual(
    NULL,
    values = c("MHI-3 >Q1" = "#009D57", "MHI-3 <= Q1" = "#EE324E")
  ) +
  facet_grid(inf_q1_mhi_3 ~ PERSONNE_pb_depress) +
  theme(legend.position = "bottom")

p_distrib_ages_2
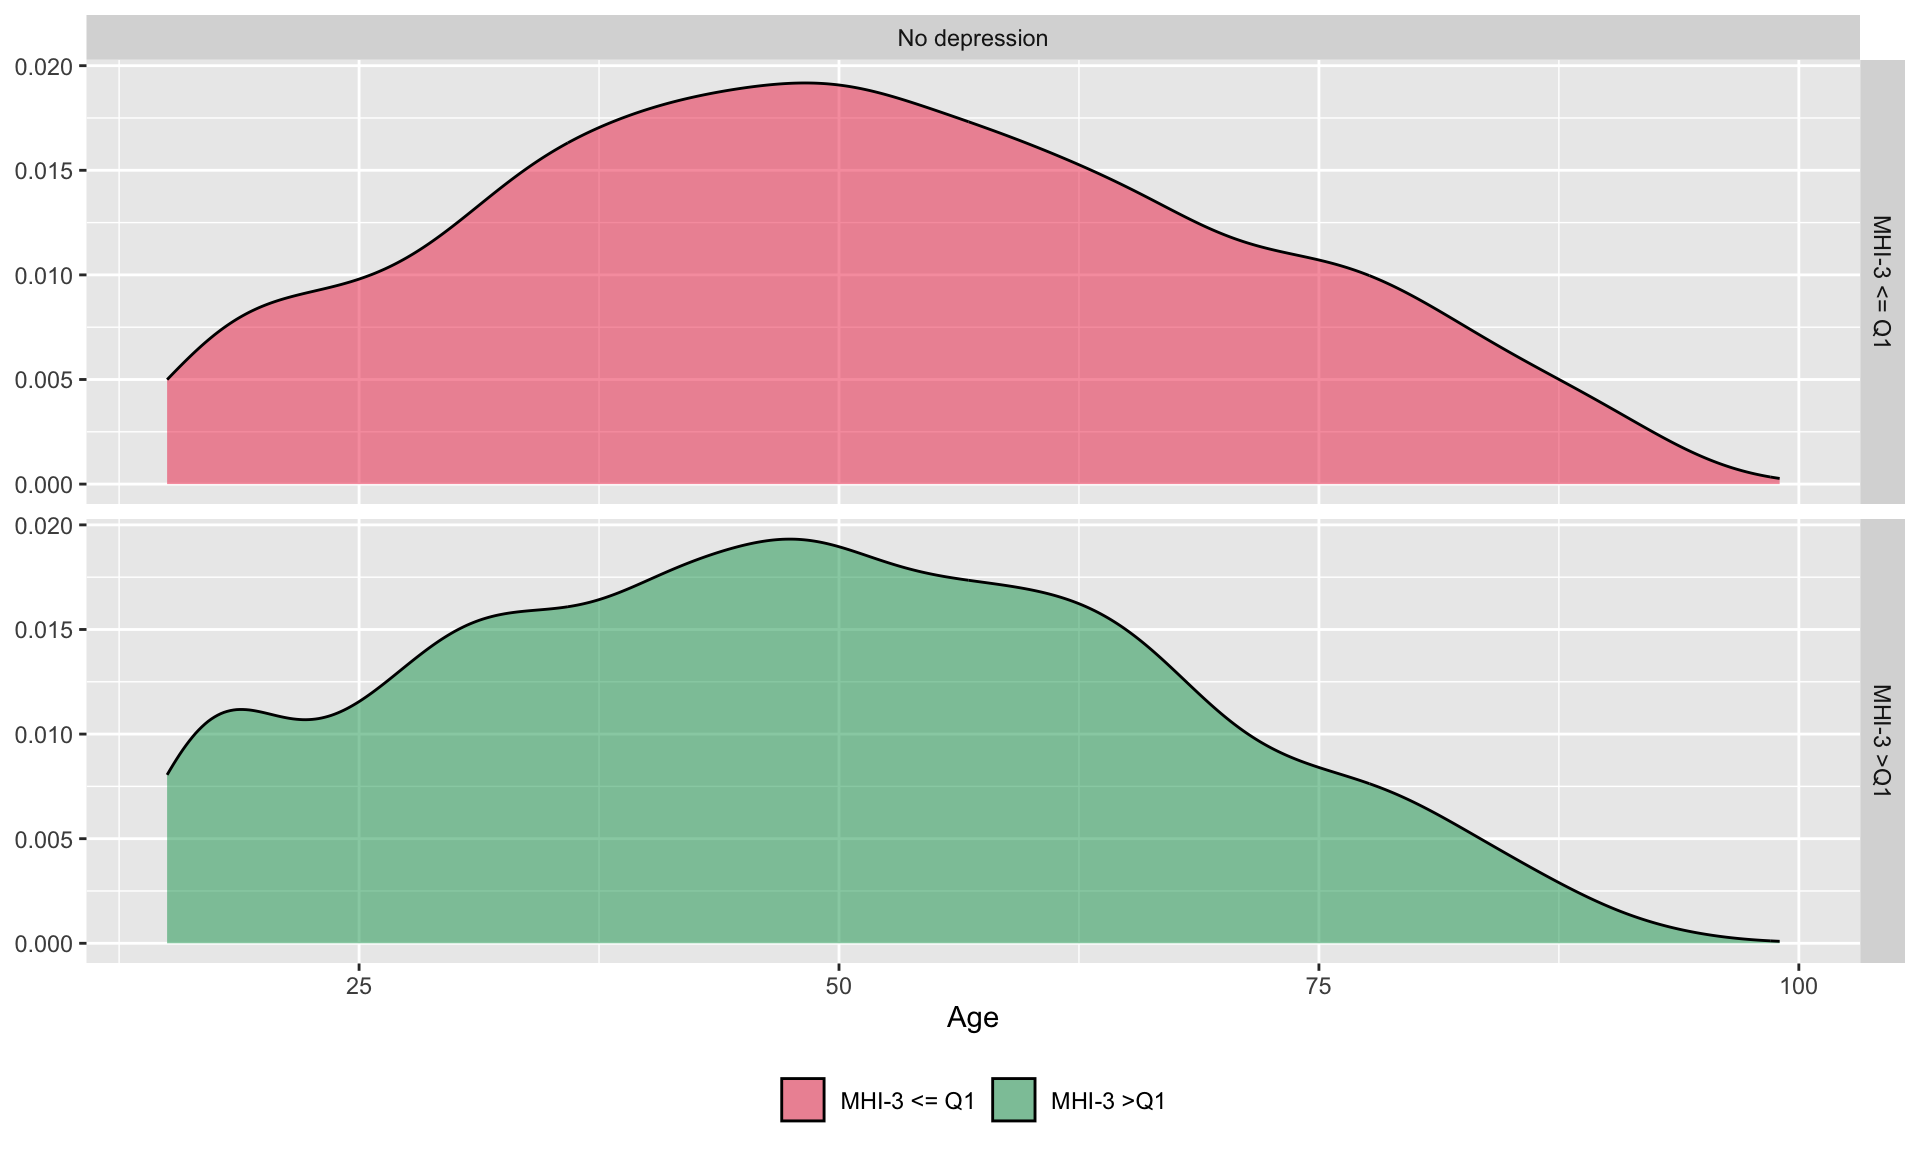
Figure 10.7: Density of age of individuals in each category

10.2 Differences Between Sub-samples

We wish to provide descriptive statistics for sub samples of the data. As the study focuses on people who report they did not experience depression during the previous year, the descriptive statistics are provided only for these individuals. We consider three different subsets:

  • all the individuals who report they did not experience depression during the previous year

  • among those:

  • individuals with a low MHI-3 score (imaginary healthy)

  • individuals with a high MHI-3.

10.2.1 Helper Functions

We first create a function that format p-values:

#' format_p_value
#' Format the p-value so that it displays "<10^{i}", if i <= 3
#' rounds the value with 2 digits otherwise
#' @param x p-value to format
#' x <- 0.000133613 ; x <- 0.0011
format_p_value <- function(x) {
  if (x < 10^-3) {
    resul <- str_c("**$< 10^{-3}$**")
  } else if (x > 10^-3) {
    if (x < 0.05) {
      resul <- str_c("**$", round(x, 3), "$**")
    } else {
      resul <- str_c("$", round(x, 3), "$")
    }
  } else {
    resul <- "**$0.001$**"
  }
  
  resul
}

Then, we create a function that provides some summary statistics for that specific variable, depending on its class:

  • if the variable is numerical: the average value
  • if the variable is categorical: the number of observation and the proportion of each category.

These summary statistics are given for each of the three subsets of data described previously. In addition, the results of a test of equality of means (for numerical variables) or proportions (for categorical ones) is provided.

#' sample_diff_depression
#' Compute descriptive statistics on `df` grouped by `grouping_var`
#' depending on the type of the variable of interest (qualitative, ordinal, numerical)
#' Then performs test of equality of mean (or proportion) on the sub-samples.
#' @param variable (string) name of the variable of interest
#' @param grouping_var (string) name of the qualitative variable that defines groups
#' @param type type of the variable (qualitative, ordinal, or numerical)
#' variable <- "PERSONNE_age" ; grouping_var <- "PERSONNE_pb_depress"
sample_diff_depression <- function(variable, 
                                   df, 
                                   grouping_var, 
                                   type = c("qualitative", "ordinal", "numerical")) {
  
  label_variable <- variable_names |> 
    filter(variable == !!variable) |> pull(label)
  
  
  if (type %in% c("qualitative", "ordinal")) {
    
    whole_sample <- 
      df |> 
      filter(!is.na(!!!syms(variable)), !is.na(!!!syms(grouping_var))) |> 
      mutate(label = label_variable) |> 
      select(label, !!!variable) |> 
      group_by(label, !!!syms(variable)) |> 
      summarise(n = n())
    
    nb_tot <- sum(whole_sample$n)
    
    whole_sample <- 
      whole_sample |> 
      mutate(
        pct = n / sum(n),
        pct = (round(100 * pct, 2)),
        pct = str_c("(", pct, "%)")
      ) |> 
      unite(`Whole Sample`, n, pct, sep = " ")
    
    subsamples <- 
      df |> 
      filter(!is.na(!!!syms(variable)), !is.na(!!!syms(grouping_var))) |> 
      mutate(label = label_variable) |> 
      select(label, !!!variable, !!!grouping_var) |> 
      group_by(label, !!!syms(variable), !!!(syms(grouping_var))) |> 
      summarize(n = n()) |> 
      group_by(!!!syms(grouping_var)) |> 
      mutate(
        pct = n / sum(n),
        pct = (round(100 * pct, 2)),
        pct = str_c("(", pct, "%)")
      ) |> 
      unite(value, n, pct, sep = " ")
    
    res <- 
      whole_sample |> 
      left_join(subsamples) |> 
      ungroup() |> 
      spread(
        key = grouping_var, 
        value = "value", 
        fill = "0 (0.00%)"
      ) |> 
      mutate(
        label = ifelse(
          row_number() == 1, 
          yes = str_c(label, " (n = ", format(nb_tot, big.mark = ","), ")"), 
          no = label
        )
      ) |> 
      unite(label, label, !!!variable, sep = " ")
    
  } else {
    
    whole_sample <- 
      df |> 
      filter(!is.na(!!!syms(variable)), !is.na(!!!syms(grouping_var))) |> 
      mutate(label = label_variable) |> 
      select(label, !!!variable)
    
    nb_tot <- nrow(whole_sample)
    
    whole_sample <- 
      whole_sample |> 
      group_by(label) |> 
      summarize(
        mean = mean(!!!syms(variable)) |> round(2),
        sd = sd(!!!syms(variable)) |> round(2)
      ) |> 
      mutate(sd = str_c("(+/-", sd, ")")) |> 
      unite(`Whole Sample`, mean, sd, sep = " ")
    
    subsamples <- 
      df |> 
      filter(!is.na(!!!syms(variable)), !is.na(!!!syms(grouping_var))) |> 
      mutate(label = label_variable) |> 
      select(label, !!!variable, !!!grouping_var) |> 
      group_by(label, !!!syms(grouping_var)) |> 
      summarize(
        mean = mean(!!!syms(variable)) |> round(2),
        sd = sd(!!!syms(variable)) |> round(2)
      ) |> 
      mutate(sd = str_c("(+/-", sd, ")")) |> 
      unite(value, mean, sd, sep = " ")
    
    res <- 
      whole_sample |> 
      left_join(subsamples) |> 
      ungroup() |> 
      spread(
        key = grouping_var,  
        value = "value", 
        fill = "0 (+/-0.00)"
      ) |> 
      mutate(
        label = ifelse(
          row_number() == 1, 
          yes = str_c(label, " (n = ", format(nb_tot, big.mark = ","), ")"), 
          no = label
        )
      )
  }
  
  if (type == "qualitative") {
    chisq_test <- chisq.test(df |> pull(grouping_var), df |> pull(variable))
    p_value <- chisq_test$p.value
  } else if (type == "ordinal") {
    kruskal_test <- kruskal.test(
      str_c(grouping_var, "~", variable) |> as.formula(), 
      data = df
    )
    p_value <- kruskal_test$p.value
  } else {
    # Numerical
    form <- str_c(variable, " ~ ", grouping_var) |> as.formula()
    anov <- aov(form, data = df)
    anov_summary <-  anov |> summary() |> pluck(1)
    p_value <- anov_summary$`Pr(>F)`[1]
  }
  
  # Adding stars for p-values
  p_value <- format_p_value(p_value)
  
  resul <- res |> mutate(p_value = c(rep("", nrow(res) - 1), p_value))
  resul
}# End of sample_diff_depression()

For example, for a numerical variable, age, on the raw sample:

sample_diff_depression(
  variable = "PERSONNE_age",
  df = df |> filter(PERSONNE_pb_depress == "No depression"),
  grouping_var = "inf_q1_mhi_3",
  type = "numerical"
)
`summarise()` has grouped output by 'label'. You can override using the
`.groups` argument.
Joining with `by = join_by(label)`
# A tibble: 1 × 5
  label            `Whole Sample`   `<=Q1`           `>Q1`            p_value   
  <chr>            <chr>            <chr>            <chr>            <chr>     
1 Age (n = 11,199) 46.65 (+/-19.01) 49.77 (+/-19.05) 45.78 (+/-18.91) **$< 10^{…

Still for age, but on the final sample:

sample_diff_depression(
  variable = "PERSONNE_age",
  df = df |> filter(in_sample, PERSONNE_pb_depress == "No depression"),
  grouping_var = "inf_q1_mhi_3",
  type = "numerical"
)
`summarise()` has grouped output by 'label'. You can override using the
`.groups` argument.
Joining with `by = join_by(label)`
# A tibble: 1 × 5
  label           `Whole Sample`  `<=Q1`          `>Q1`            p_value      
  <chr>           <chr>           <chr>           <chr>            <chr>        
1 Age (n = 5,293) 48.7 (+/-18.58) 50.97 (+/-18.8) 47.99 (+/-18.45) **$< 10^{-3}…

And for a categorical variables (gender):

sample_diff_depression(
  variable = "PERSONNE_sexe",
  df = df |> filter(PERSONNE_pb_depress == "No depression"),
  grouping_var = "inf_q1_mhi_3",
  type = "qualitative"
)
`summarise()` has grouped output by 'label'. You can override using the
`.groups` argument.
`summarise()` has grouped output by 'label', 'PERSONNE_sexe'. You can override
using the `.groups` argument.
Joining with `by = join_by(label, PERSONNE_sexe)`
# A tibble: 2 × 5
  label                      `Whole Sample` `<=Q1`        `>Q1`         p_value 
  <chr>                      <chr>          <chr>         <chr>         <chr>   
1 Gender (n = 11,199) Female 5736 (51.22%)  1486 (60.93%) 4250 (48.52%) ""      
2 Gender Male                5463 (48.78%)  953 (39.07%)  4510 (51.48%) "**$< 1…

Then, we can create a function that applies the previously defined sample_diff_depression() function to some variables (to create descriptive statistics for some groups of variables).

library(xtable)

#' print_tableau
#' Creates a table with descriptive statistics for all variables in `variable_names[ind, ]`
#' Creates subsets depending on `inf_q1_mhi_5`
#' @param ind index of the variables in `variable_names` to put in the table
#' @param df data frame to use
#' @param grouping_var variable to create subsamples from
print_tableau <- function(ind, df, grouping_var = "inf_q1_mhi_3") {
  table_desc_stat <- 
    map_dfr(ind, function(i){
      sample_diff_depression(
        variable = variable_names$variable[i],
        df = df |> filter(PERSONNE_pb_depress == "No depression"),
        grouping_var = grouping_var,
        type = variable_names$type[i]
      ) |> 
        mutate(variable = variable_names$variable[i])
    }) |> 
    ungroup()
  
  table_desc_stat |> select(-variable)
}# End of print_tableau()

This function can eventually be applied to some groups of variables.

10.2.2 Tables

Table 10.1: Personnal characteristics
ind_personnes <- which(str_detect(variable_names$variable, "^PERSONNE_"))
print_tableau(ind = ind_personnes[-1], df = df) |> 
  kableExtra::kable(format = "html", escape = FALSE) |> 
  kableExtra::kable_classic(full_width = F, html_font = "Cambria") |> 
  kableExtra::kable_styling(
    bootstrap_options = c("striped", "hover", "condensed", "responsive")
  ) |> 
  kableExtra::kable_styling() |>
  unclass() |> cat()
label Whole Sample >Q1 p_value
Asthma (n = 11,199) No 10465 (93.45%) 2200 (90.2%) 8265 (94.35%)
Asthma Yes 734 (6.55%) 239 (9.8%) 495 (5.65%) \(< 10^{-3}\)
Bronchitis (n = 11,199) No 10636 (94.97%) 2204 (90.36%) 8432 (96.26%)
Bronchitis Yes 563 (5.03%) 235 (9.64%) 328 (3.74%) \(< 10^{-3}\)
Heart Attack (n = 11,199) No 11140 (99.47%) 2412 (98.89%) 8728 (99.63%)
Heart Attack Yes 59 (0.53%) 27 (1.11%) 32 (0.37%) \(< 10^{-3}\)
Artery Disease (n = 11,199) No 11024 (98.44%) 2363 (96.88%) 8661 (98.87%)
Artery Disease Yes 175 (1.56%) 76 (3.12%) 99 (1.13%) \(< 10^{-3}\)
Hypertension (n = 11,199) No 9940 (88.76%) 2046 (83.89%) 7894 (90.11%)
Hypertension Yes 1259 (11.24%) 393 (16.11%) 866 (9.89%) \(< 10^{-3}\)
Stroke (n = 11,199) No 11133 (99.41%) 2410 (98.81%) 8723 (99.58%)
Stroke Yes 66 (0.59%) 29 (1.19%) 37 (0.42%) \(< 10^{-3}\)
Osteoarthritis (n = 11,199) No 9896 (88.37%) 1985 (81.39%) 7911 (90.31%)
Osteoarthritis Yes 1303 (11.63%) 454 (18.61%) 849 (9.69%) \(< 10^{-3}\)
Low Back Pain (n = 11,199) No 9161 (81.8%) 1782 (73.06%) 7379 (84.24%)
Low Back Pain Yes 2038 (18.2%) 657 (26.94%) 1381 (15.76%) \(< 10^{-3}\)
Neck Pain (n = 11,199) No 9753 (87.09%) 1930 (79.13%) 7823 (89.3%)
Neck Pain Yes 1446 (12.91%) 509 (20.87%) 937 (10.7%) \(< 10^{-3}\)
Diabetes (n = 11,199) No 10339 (92.32%) 2131 (87.37%) 8208 (93.7%)
Diabetes Yes 860 (7.68%) 308 (12.63%) 552 (6.3%) \(< 10^{-3}\)
Allergy (n = 11,199) No 9665 (86.3%) 2027 (83.11%) 7638 (87.19%)
Allergy Yes 1534 (13.7%) 412 (16.89%) 1122 (12.81%) \(< 10^{-3}\)
Cirrhosis (n = 11,199) No 11189 (99.91%) 2435 (99.84%) 8754 (99.93%)
Cirrhosis Yes 10 (0.09%) 4 (0.16%) 6 (0.07%) \(0.311\)
Urinary Incontinence (n = 11,199) No 10800 (96.44%) 2253 (92.37%) 8547 (97.57%)
Urinary Incontinence Yes 399 (3.56%) 186 (7.63%) 213 (2.43%) \(< 10^{-3}\)
MHI-5 Score (n = 11,199) 70.66 (+/-17.43) 45.96 (+/-12.44) 77.54 (+/-11.31) \(< 10^{-3}\)
Self-Assessed Health Condition (n = 11,199) Not reported 59 (0.53%) 19 (0.78%) 40 (0.46%)
Self-Assessed Health Condition Very Bad or Bad 630 (5.63%) 397 (16.28%) 233 (2.66%)
Self-Assessed Health Condition Very Good, Good or Fairly Good 10510 (93.85%) 2023 (82.94%) 8487 (96.88%) \(< 10^{-3}\)
Age (n = 11,199) 46.65 (+/-19.01) 49.77 (+/-19.05) 45.78 (+/-18.91) \(< 10^{-3}\)
Gender (n = 11,199) Female 5736 (51.22%) 1486 (60.93%) 4250 (48.52%)
Gender Male 5463 (48.78%) 953 (39.07%) 4510 (51.48%) \(< 10^{-3}\)
Couple (n = 11,199) No 3580 (31.97%) 882 (36.16%) 2698 (30.8%)
Couple Not reported 38 (0.34%) 3 (0.12%) 35 (0.4%)
Couple Yes 7581 (67.69%) 1554 (63.71%) 6027 (68.8%) \(< 10^{-3}\)
Marital Status (n = 11,016) Married, Civil Union 6287 (57.07%) 1280 (52.81%) 5007 (58.28%)
Marital Status Divorced, separated 531 (4.82%) 189 (7.8%) 342 (3.98%)
Marital Status Widowed 484 (4.39%) 187 (7.71%) 297 (3.46%)
Marital Status Lives in a marriage or concubinage 1287 (11.68%) 273 (11.26%) 1014 (11.8%)
Marital Status Single 2415 (21.92%) 494 (20.38%) 1921 (22.36%)
Marital Status Does not know 4 (0.04%) 0 (0.00%) 4 (0.05%)
Marital Status Refuses to answer 8 (0.07%) 1 (0.04%) 7 (0.08%) \(< 10^{-3}\)
Professional Status (n = 11,199) Public employee 1922 (17.16%) 440 (18.04%) 1482 (16.92%)
Professional Status Private employee 6166 (55.06%) 1397 (57.28%) 4769 (54.44%)
Professional Status Other 1534 (13.7%) 311 (12.75%) 1223 (13.96%)
Professional Status No answer 1577 (14.08%) 291 (11.93%) 1286 (14.68%) \(< 10^{-3}\)
Social Security (n = 11,151) Yes (own) 9721 (87.18%) 2129 (87.9%) 7592 (86.97%)
Social Security Yes (third party) 1430 (12.82%) 293 (12.1%) 1137 (13.03%) \(0.24\)
Social Security System (n = 11,177) The general scheme (Cnamts) 7858 (70.31%) 1757 (72.13%) 6101 (69.8%)
Social Security System Public service 925 (8.28%) 179 (7.35%) 746 (8.53%)
Social Security System The local Alsace-Moselle scheme 386 (3.45%) 105 (4.31%) 281 (3.21%)
Social Security System The basic Universal Health Coverage 237 (2.12%) 85 (3.49%) 152 (1.74%)
Social Security System The agricultural scheme 741 (6.63%) 142 (5.83%) 599 (6.85%)
Social Security System The self-employed scheme 673 (6.02%) 113 (4.64%) 560 (6.41%)
Social Security System Other (Student, abroad, other) 337 (3.02%) 48 (1.97%) 289 (3.31%)
Social Security System Does not know 20 (0.18%) 7 (0.29%) 13 (0.15%) \(< 10^{-3}\)
Occupation (n = 11,189) Farmer 383 (3.42%) 71 (2.91%) 312 (3.56%)
Occupation Craftsman, trader 567 (5.07%) 106 (4.35%) 461 (5.27%)
Occupation Executive and intellectual profession 1443 (12.9%) 248 (10.18%) 1195 (13.65%)
Occupation Intermediate occupation 1875 (16.76%) 364 (14.94%) 1511 (17.26%)
Occupation Administrative employee 1498 (13.39%) 388 (15.92%) 1110 (12.68%)
Occupation Commercial employee 1315 (11.75%) 379 (15.55%) 936 (10.69%)
Occupation Skilled worker 1621 (14.49%) 351 (14.4%) 1270 (14.51%)
Occupation Unskilled worker 892 (7.97%) 221 (9.07%) 671 (7.67%)
Occupation Inactive having never worked 1595 (14.26%) 309 (12.68%) 1286 (14.69%) \(< 10^{-3}\)
Long-term condition (Self-declared) (n = 11,199) Yes 1897 (16.94%) 637 (26.12%) 1260 (14.38%)
Long-term condition (Self-declared) No 9267 (82.75%) 1794 (73.55%) 7473 (85.31%)
Long-term condition (Self-declared) Does not know 35 (0.31%) 8 (0.33%) 27 (0.31%) \(< 10^{-3}\)
Table 10.2: Personnal characteristics
ind_personnes <- which(str_detect(variable_names$variable, "^PERSONNE_"))
# variable_names |> slice(ind_personnes)
print_tableau(ind = ind_personnes[-1], df = df |> filter(in_sample)) |> 
  kableExtra::kable(format = "html", escape = FALSE) |> 
  kableExtra::kable_classic(full_width = F, html_font = "Cambria") |> 
  kableExtra::kable_styling(
    bootstrap_options = c("striped", "hover", "condensed", "responsive")
  ) |> 
  kableExtra::kable_styling() |>
  unclass() |> cat()
label Whole Sample >Q1 p_value
Asthma (n = 5,293) No 4934 (93.22%) 1118 (88.59%) 3816 (94.67%)
Asthma Yes 359 (6.78%) 144 (11.41%) 215 (5.33%) \(< 10^{-3}\)
Bronchitis (n = 5,293) No 4987 (94.22%) 1118 (88.59%) 3869 (95.98%)
Bronchitis Yes 306 (5.78%) 144 (11.41%) 162 (4.02%) \(< 10^{-3}\)
Heart Attack (n = 5,293) No 5259 (99.36%) 1246 (98.73%) 4013 (99.55%)
Heart Attack Yes 34 (0.64%) 16 (1.27%) 18 (0.45%) \(0.003\)
Artery Disease (n = 5,293) No 5190 (98.05%) 1216 (96.35%) 3974 (98.59%)
Artery Disease Yes 103 (1.95%) 46 (3.65%) 57 (1.41%) \(< 10^{-3}\)
Hypertension (n = 5,293) No 4662 (88.08%) 1057 (83.76%) 3605 (89.43%)
Hypertension Yes 631 (11.92%) 205 (16.24%) 426 (10.57%) \(< 10^{-3}\)
Stroke (n = 5,293) No 5265 (99.47%) 1249 (98.97%) 4016 (99.63%)
Stroke Yes 28 (0.53%) 13 (1.03%) 15 (0.37%) \(0.01\)
Osteoarthritis (n = 5,293) No 4586 (86.64%) 1019 (80.74%) 3567 (88.49%)
Osteoarthritis Yes 707 (13.36%) 243 (19.26%) 464 (11.51%) \(< 10^{-3}\)
Low Back Pain (n = 5,293) No 4215 (79.63%) 900 (71.32%) 3315 (82.24%)
Low Back Pain Yes 1078 (20.37%) 362 (28.68%) 716 (17.76%) \(< 10^{-3}\)
Neck Pain (n = 5,293) No 4519 (85.38%) 983 (77.89%) 3536 (87.72%)
Neck Pain Yes 774 (14.62%) 279 (22.11%) 495 (12.28%) \(< 10^{-3}\)
Diabetes (n = 5,293) No 4848 (91.59%) 1068 (84.63%) 3780 (93.77%)
Diabetes Yes 445 (8.41%) 194 (15.37%) 251 (6.23%) \(< 10^{-3}\)
Allergy (n = 5,293) No 4520 (85.4%) 1042 (82.57%) 3478 (86.28%)
Allergy Yes 773 (14.6%) 220 (17.43%) 553 (13.72%) \(0.001\)
Cirrhosis (n = 5,293) No 5286 (99.87%) 1259 (99.76%) 4027 (99.9%)
Cirrhosis Yes 7 (0.13%) 3 (0.24%) 4 (0.1%) \(0.461\)
Urinary Incontinence (n = 5,293) No 5071 (95.81%) 1157 (91.68%) 3914 (97.1%)
Urinary Incontinence Yes 222 (4.19%) 105 (8.32%) 117 (2.9%) \(< 10^{-3}\)
MHI-5 Score (n = 5,293) 69.97 (+/-17.93) 45.65 (+/-12.76) 77.59 (+/-11.32) \(< 10^{-3}\)
Self-Assessed Health Condition (n = 5,293) Not reported 22 (0.42%) 6 (0.48%) 16 (0.4%)
Self-Assessed Health Condition Very Bad or Bad 344 (6.5%) 241 (19.1%) 103 (2.56%)
Self-Assessed Health Condition Very Good, Good or Fairly Good 4927 (93.09%) 1015 (80.43%) 3912 (97.05%) \(< 10^{-3}\)
Age (n = 5,293) 48.7 (+/-18.58) 50.97 (+/-18.8) 47.99 (+/-18.45) \(< 10^{-3}\)
Gender (n = 5,293) Female 2765 (52.24%) 756 (59.9%) 2009 (49.84%)
Gender Male 2528 (47.76%) 506 (40.1%) 2022 (50.16%) \(< 10^{-3}\)
Couple (n = 5,293) No 1830 (34.57%) 538 (42.63%) 1292 (32.05%)
Couple Yes 3463 (65.43%) 724 (57.37%) 2739 (67.95%) \(< 10^{-3}\)
Marital Status (n = 5,235) Married, Civil Union 2861 (54.65%) 586 (46.51%) 2275 (57.23%)
Marital Status Divorced, separated 437 (8.35%) 160 (12.7%) 277 (6.97%)
Marital Status Widowed 336 (6.42%) 126 (10%) 210 (5.28%)
Marital Status Lives in a marriage or concubinage 600 (11.46%) 138 (10.95%) 462 (11.62%)
Marital Status Single 996 (19.03%) 250 (19.84%) 746 (18.77%)
Marital Status Does not know 1 (0.02%) 0 (0.00%) 1 (0.03%)
Marital Status Refuses to answer 4 (0.08%) 0 (0.00%) 4 (0.1%) \(< 10^{-3}\)
Professional Status (n = 5,293) Public employee 854 (16.13%) 224 (17.75%) 630 (15.63%)
Professional Status Private employee 3153 (59.57%) 763 (60.46%) 2390 (59.29%)
Professional Status Other 737 (13.92%) 158 (12.52%) 579 (14.36%)
Professional Status No answer 549 (10.37%) 117 (9.27%) 432 (10.72%) \(0.066\)
Social Security (n = 5,293) Yes (own) 4554 (86.04%) 1096 (86.85%) 3458 (85.79%)
Social Security Yes (third party) 739 (13.96%) 166 (13.15%) 573 (14.21%) \(0.367\)
Social Security System (n = 5,293) The general scheme (Cnamts) 3959 (74.8%) 960 (76.07%) 2999 (74.4%)
Social Security System Public service 294 (5.55%) 65 (5.15%) 229 (5.68%)
Social Security System The local Alsace-Moselle scheme 187 (3.53%) 53 (4.2%) 134 (3.32%)
Social Security System The basic Universal Health Coverage 151 (2.85%) 56 (4.44%) 95 (2.36%)
Social Security System The agricultural scheme 340 (6.42%) 69 (5.47%) 271 (6.72%)
Social Security System The self-employed scheme 338 (6.39%) 57 (4.52%) 281 (6.97%)
Social Security System Other (Student, abroad, other) 19 (0.36%) 0 (0.00%) 19 (0.47%)
Social Security System Does not know 5 (0.09%) 2 (0.16%) 3 (0.07%) \(< 10^{-3}\)
Occupation (n = 5,293) Farmer 160 (3.02%) 29 (2.3%) 131 (3.25%)
Occupation Craftsman, trader 292 (5.52%) 61 (4.83%) 231 (5.73%)
Occupation Executive and intellectual profession 745 (14.08%) 133 (10.54%) 612 (15.18%)
Occupation Intermediate occupation 931 (17.59%) 197 (15.61%) 734 (18.21%)
Occupation Administrative employee 713 (13.47%) 213 (16.88%) 500 (12.4%)
Occupation Commercial employee 650 (12.28%) 193 (15.29%) 457 (11.34%)
Occupation Skilled worker 824 (15.57%) 197 (15.61%) 627 (15.55%)
Occupation Unskilled worker 418 (7.9%) 116 (9.19%) 302 (7.49%)
Occupation Inactive having never worked 560 (10.58%) 123 (9.75%) 437 (10.84%) \(< 10^{-3}\)
Long-term condition (Self-declared) (n = 5,293) Yes 1018 (19.23%) 370 (29.32%) 648 (16.08%)
Long-term condition (Self-declared) No 4262 (80.52%) 888 (70.36%) 3374 (83.7%)
Long-term condition (Self-declared) Does not know 13 (0.25%) 4 (0.32%) 9 (0.22%) \(< 10^{-3}\)
Table 10.3: Household characteristics
ind_menages <- which(str_detect(variable_names$variable, "^MENAGE_"))
ind_menages <- c(ind_menages, which(variable_names$variable == "ensol_2011"))
print_tableau(ind = ind_menages, df = df) |> 
  kableExtra::kable(format = "html", escape = FALSE) |> 
  kableExtra::kable_classic(full_width = F, html_font = "Cambria") |> 
  kableExtra::kable_styling(
    bootstrap_options = c("striped", "hover", "condensed", "responsive")
  ) |> 
  kableExtra::kable_styling() |>
  unclass() |> cat()
label Whole Sample >Q1 p_value
Zoning in Urban Areas (n = 11,199) Major urban cluster (and its crown) 7941 (70.91%) 1627 (66.71%) 6314 (72.08%)
Zoning in Urban Areas Medium/small urban cluster (and its crown) 1491 (13.31%) 306 (12.55%) 1185 (13.53%)
Zoning in Urban Areas Spaces outside the area of influence of cities 522 (4.66%) 112 (4.59%) 410 (4.68%)
Zoning in Urban Areas No answer 1245 (11.12%) 394 (16.15%) 851 (9.71%) \(< 10^{-3}\)
Region (n = 11,199) Région parisienne 1691 (15.1%) 369 (15.13%) 1322 (15.09%)
Region Champagne-Ardenne 297 (2.65%) 69 (2.83%) 228 (2.6%)
Region Picardie 428 (3.82%) 86 (3.53%) 342 (3.9%)
Region Haute-Normandie 300 (2.68%) 52 (2.13%) 248 (2.83%)
Region Centre 465 (4.15%) 107 (4.39%) 358 (4.09%)
Region Basse-Normandie 283 (2.53%) 60 (2.46%) 223 (2.55%)
Region Bourgogne 329 (2.94%) 74 (3.03%) 255 (2.91%)
Region Nord-Pas-de-Calais 740 (6.61%) 179 (7.34%) 561 (6.4%)
Region Lorraine 522 (4.66%) 118 (4.84%) 404 (4.61%)
Region Alsace 347 (3.1%) 88 (3.61%) 259 (2.96%)
Region Franche-Comté 250 (2.23%) 46 (1.89%) 204 (2.33%)
Region Pays de la Loire 700 (6.25%) 153 (6.27%) 547 (6.24%)
Region Bretagne 606 (5.41%) 122 (5%) 484 (5.53%)
Region Poitou-Charentes 363 (3.24%) 62 (2.54%) 301 (3.44%)
Region Aquitaine 563 (5.03%) 125 (5.13%) 438 (5%)
Region Midi-Pyrénées 573 (5.12%) 116 (4.76%) 457 (5.22%)
Region Limousin 103 (0.92%) 20 (0.82%) 83 (0.95%)
Region Rhône-Alpes 1217 (10.87%) 255 (10.46%) 962 (10.98%)
Region Auvergne 272 (2.43%) 71 (2.91%) 201 (2.29%)
Region Languedoc-Roussillon 433 (3.87%) 96 (3.94%) 337 (3.85%)
Region Provence-Alpes-Côte d’Azur 706 (6.3%) 169 (6.93%) 537 (6.13%)
Region Corse 11 (0.1%) 2 (0.08%) 9 (0.1%) \(0.268\)
Income (n = 8,502) 3109.47 (+/-1986.67) 2615.99 (+/-1573.88) 3249.38 (+/-2067.7) \(< 10^{-3}\)
Net Income per Cons. Unit (n = 9,626) 1635.73 (+/-972.8) 1433.99 (+/-798.45) 1692.54 (+/-1009.31) \(< 10^{-3}\)
Size Urban Area (n = 11,199) Small Municipality 4319 (38.57%) 839 (34.4%) 3480 (39.73%)
Size Urban Area Medium Municipality 1220 (10.89%) 253 (10.37%) 967 (11.04%)
Size Urban Area Large Municipality 3243 (28.96%) 714 (29.27%) 2529 (28.87%)
Size Urban Area Paris metropolitan area 1172 (10.47%) 239 (9.8%) 933 (10.65%)
Size Urban Area No answer 1245 (11.12%) 394 (16.15%) 851 (9.71%) \(< 10^{-3}\)
Household size (n = 11,199) 3.12 (+/-1.41) 2.95 (+/-1.43) 3.16 (+/-1.4) \(< 10^{-3}\)
Sunlight (n = 11,199) 2083.94 (+/-306.62) 2086.5 (+/-311.21) 2083.22 (+/-305.34) \(0.641\)
Table 10.4: Household characteristics
ind_menages <- which(str_detect(variable_names$variable, "^MENAGE_"))
ind_menages <- c(ind_menages, which(variable_names$variable == "ensol_2011"))
print_tableau(ind = ind_menages, df = df |> filter(in_sample)) |> 
  kableExtra::kable(format = "html", escape = FALSE) |> 
  kableExtra::kable_classic(full_width = F, html_font = "Cambria") |> 
  kableExtra::kable_styling(
    bootstrap_options = c("striped", "hover", "condensed", "responsive")
  ) |> 
  kableExtra::kable_styling() |>
  unclass() |> cat()
label Whole Sample >Q1 p_value
Zoning in Urban Areas (n = 5,293) Major urban cluster (and its crown) 3680 (69.53%) 795 (63%) 2885 (71.57%)
Zoning in Urban Areas Medium/small urban cluster (and its crown) 697 (13.17%) 171 (13.55%) 526 (13.05%)
Zoning in Urban Areas Spaces outside the area of influence of cities 238 (4.5%) 52 (4.12%) 186 (4.61%)
Zoning in Urban Areas No answer 678 (12.81%) 244 (19.33%) 434 (10.77%) \(< 10^{-3}\)
Region (n = 5,293) Région parisienne 739 (13.96%) 169 (13.39%) 570 (14.14%)
Region Champagne-Ardenne 148 (2.8%) 36 (2.85%) 112 (2.78%)
Region Picardie 200 (3.78%) 48 (3.8%) 152 (3.77%)
Region Haute-Normandie 145 (2.74%) 25 (1.98%) 120 (2.98%)
Region Centre 194 (3.67%) 39 (3.09%) 155 (3.85%)
Region Basse-Normandie 141 (2.66%) 39 (3.09%) 102 (2.53%)
Region Bourgogne 148 (2.8%) 35 (2.77%) 113 (2.8%)
Region Nord-Pas-de-Calais 376 (7.1%) 103 (8.16%) 273 (6.77%)
Region Lorraine 245 (4.63%) 62 (4.91%) 183 (4.54%)
Region Alsace 154 (2.91%) 43 (3.41%) 111 (2.75%)
Region Franche-Comté 115 (2.17%) 24 (1.9%) 91 (2.26%)
Region Pays de la Loire 344 (6.5%) 85 (6.74%) 259 (6.43%)
Region Bretagne 281 (5.31%) 61 (4.83%) 220 (5.46%)
Region Poitou-Charentes 178 (3.36%) 33 (2.61%) 145 (3.6%)
Region Aquitaine 278 (5.25%) 65 (5.15%) 213 (5.28%)
Region Midi-Pyrénées 260 (4.91%) 61 (4.83%) 199 (4.94%)
Region Limousin 52 (0.98%) 14 (1.11%) 38 (0.94%)
Region Rhône-Alpes 596 (11.26%) 136 (10.78%) 460 (11.41%)
Region Auvergne 122 (2.3%) 36 (2.85%) 86 (2.13%)
Region Languedoc-Roussillon 220 (4.16%) 58 (4.6%) 162 (4.02%)
Region Provence-Alpes-Côte d’Azur 350 (6.61%) 89 (7.05%) 261 (6.47%)
Region Corse 7 (0.13%) 1 (0.08%) 6 (0.15%) \(0.558\)
Income (n = 4,698) 2855.27 (+/-1893.64) 2338.23 (+/-1442.41) 3017.69 (+/-1987.23) \(< 10^{-3}\)
Net Income per Cons. Unit (n = 5,293) 1609.51 (+/-1008.13) 1387.88 (+/-800.52) 1678.9 (+/-1055.4) \(< 10^{-3}\)
Size Urban Area (n = 5,293) Small Municipality 1954 (36.92%) 420 (33.28%) 1534 (38.06%)
Size Urban Area Medium Municipality 554 (10.47%) 132 (10.46%) 422 (10.47%)
Size Urban Area Large Municipality 1587 (29.98%) 361 (28.61%) 1226 (30.41%)
Size Urban Area Paris metropolitan area 520 (9.82%) 105 (8.32%) 415 (10.3%)
Size Urban Area No answer 678 (12.81%) 244 (19.33%) 434 (10.77%) \(< 10^{-3}\)
Household size (n = 5,293) 2.84 (+/-1.44) 2.68 (+/-1.46) 2.89 (+/-1.43) \(< 10^{-3}\)
Sunlight (n = 5,293) 2088.7 (+/-311.91) 2090.6 (+/-316.73) 2088.1 (+/-310.42) \(0.804\)
Table 10.5: Healthcare expenditures
ind_soins <- which(str_detect(variable_names$variable, "^SOINS_"))
print_tableau(ind = ind_soins, df = df) |> 
  kableExtra::kable(format = "html", escape = FALSE) |> 
  kableExtra::kable_classic(full_width = F, html_font = "Cambria") |> 
  kableExtra::kable_styling(
    bootstrap_options = c("striped", "hover", "condensed", "responsive")
  ) |> 
  kableExtra::kable_styling() |>
  unclass() |> cat()
label Whole Sample >Q1 p_value
Long-term condition (SNIIRAM) (n = 11,199) Yes 1195 (10.67%) 409 (16.77%) 786 (8.97%)
Long-term condition (SNIIRAM) No 4916 (43.9%) 1037 (42.52%) 3879 (44.28%)
Long-term condition (SNIIRAM) No answer 5088 (45.43%) 993 (40.71%) 4095 (46.75%) \(< 10^{-3}\)
Exp. Outpatient (n = 6,111) 1480.89 (+/-2502.01) 2183.76 (+/-3455.72) 1263.03 (+/-2073.74) \(< 10^{-3}\)
Exp. General Practitioner (n = 6,111) 125.37 (+/-142.52) 171.23 (+/-177.89) 111.16 (+/-126.29) \(< 10^{-3}\)
Exp. Specialist (n = 6,111) 194.57 (+/-370.54) 237.44 (+/-413.77) 181.29 (+/-355.08) \(< 10^{-3}\)
Exp. Pharmacy (n = 6,111) 468.27 (+/-1417.02) 740.4 (+/-1788.97) 383.91 (+/-1268.41) \(< 10^{-3}\)
Exp. Physiotherapist (n = 6,111) 62.74 (+/-246.97) 112.38 (+/-386.05) 47.35 (+/-180.91) \(< 10^{-3}\)
Exp. Nurse (n = 6,111) 76 (+/-661.9) 171.18 (+/-1024.27) 46.5 (+/-495.21) \(< 10^{-3}\)
Exp. Dentist (n = 6,111) 164.91 (+/-506.53) 177.76 (+/-543.43) 160.92 (+/-494.53) \(0.269\)
Exp. Equipment (n = 6,111) 82.61 (+/-507.59) 154.19 (+/-711.18) 60.42 (+/-422.78) \(< 10^{-3}\)
Exp. Transport (n = 6,111) 55.43 (+/-580.77) 122.51 (+/-976.36) 34.64 (+/-380.38) \(< 10^{-3}\)
Exp. Optical (n = 6,111) 105.25 (+/-224.96) 102 (+/-217.12) 106.26 (+/-227.35) \(0.529\)
Exp. Prostheses (n = 6,111) 40.49 (+/-256.45) 58.61 (+/-320.1) 34.87 (+/-232.97) \(0.002\)
Exp. Emergency w/o hospitalization (n = 6,111) 14.93 (+/-51.42) 19.39 (+/-59.83) 13.54 (+/-48.44) \(< 10^{-3}\)
Reimbursement Outpatient (n = 6,111) 974.4 (+/-2292.02) 1599.82 (+/-3250.88) 780.54 (+/-1857.15) \(< 10^{-3}\)
Reimbursement General Practitioner (n = 6,111) 89.16 (+/-111.97) 128.21 (+/-147.1) 77.05 (+/-95.4) \(< 10^{-3}\)
Reimbursement Specialist (n = 6,111) 133.46 (+/-295.08) 173.1 (+/-361.86) 121.18 (+/-269.92) \(< 10^{-3}\)
Reimbursement Pharmacy (n = 6,111) 360.83 (+/-1375.28) 597.9 (+/-1725.78) 287.35 (+/-1237.83) \(< 10^{-3}\)
Reimbursement Physiotherapist (n = 6,111) 45.9 (+/-219.61) 89.08 (+/-361.67) 32.51 (+/-147.99) \(< 10^{-3}\)
Reimbursement Nurse (n = 6,111) 69.62 (+/-640.78) 163.64 (+/-1017.76) 40.48 (+/-461.93) \(< 10^{-3}\)
Reimbursement Dentist (n = 6,111) 58.31 (+/-134.96) 63.74 (+/-157.84) 56.62 (+/-127.01) \(0.08\)
Reimbursement Equipment (n = 6,111) 70.7 (+/-483.74) 137.42 (+/-677.23) 50.01 (+/-403.29) \(< 10^{-3}\)
Reimbursement Transport (n = 6,111) 52.61 (+/-576.69) 117.03 (+/-970.45) 32.65 (+/-377.11) \(< 10^{-3}\)
Reimbursement Optical (n = 6,111) 2.67 (+/-6.18) 2.84 (+/-6.32) 2.62 (+/-6.13) \(0.228\)
Reimbursement Prostheses (n = 6,111) 13.98 (+/-107.8) 22.07 (+/-154.01) 11.48 (+/-88.6) \(0.001\)
Reimbursement Emergency w/o hospitalization (n = 6,111) 11.96 (+/-40.84) 15.79 (+/-48.19) 10.77 (+/-38.21) \(< 10^{-3}\)
Co-payment Outpatient (n = 6,111) 236.12 (+/-271.94) 290.81 (+/-324.36) 219.16 (+/-251.13) \(< 10^{-3}\)
Co-payment General Practitioner (n = 6,111) 26.99 (+/-34.93) 31.81 (+/-41.27) 25.5 (+/-32.58) \(< 10^{-3}\)
Co-payment Specialist (n = 6,111) 32.65 (+/-46.64) 36.31 (+/-52.84) 31.52 (+/-44.49) \(< 10^{-3}\)
Co-payment Pharmacy (n = 6,111) 93.68 (+/-141.18) 124.91 (+/-183.78) 84 (+/-123.5) \(< 10^{-3}\)
Co-payment Physiotherapist (n = 6,111) 14.83 (+/-52) 19.89 (+/-61.26) 13.26 (+/-48.68) \(< 10^{-3}\)
Co-payment Nurse (n = 6,111) 5.38 (+/-74.11) 5.83 (+/-31.5) 5.24 (+/-82.99) \(0.793\)
Co-payment Dentist (n = 6,111) 21.34 (+/-52.35) 22.73 (+/-58.44) 20.91 (+/-50.31) \(0.247\)
Co-payment Equipment (n = 6,111) 10.04 (+/-64.15) 13.43 (+/-85.04) 8.99 (+/-56.09) \(0.022\)
Co-payment Transport (n = 6,111) 2.07 (+/-21.42) 4.02 (+/-34.94) 1.47 (+/-14.88) \(< 10^{-3}\)
Co-payment Optical (n = 6,111) 1.59 (+/-3.83) 1.61 (+/-3.91) 1.58 (+/-3.81) \(0.795\)
Co-payment Prostheses (n = 6,111) 4.69 (+/-18.03) 5.2 (+/-17.59) 4.53 (+/-18.16) \(0.217\)
Co-payment Emergency w/o hospitalization (n = 6,111) 2.71 (+/-11.42) 3.3 (+/-13.18) 2.53 (+/-10.82) \(0.025\)
Extra-fees Outpatient (n = 6,111) 242.04 (+/-504.03) 256.67 (+/-537.51) 237.51 (+/-493.16) \(0.207\)
Extra-fees General Practitioner (n = 6,111) 5.28 (+/-29.19) 6.1 (+/-31.7) 5.02 (+/-28.36) \(0.219\)
Extra-fees Specialist (n = 6,111) 24.63 (+/-104.4) 23.55 (+/-78.87) 24.96 (+/-111.14) \(0.653\)
Extra-fees Pharmacy (n = 6,111) 0.2 (+/-7.27) 0.31 (+/-8.13) 0.17 (+/-6.99) \(0.524\)
Extra-fees Physiotherapist (n = 6,111) 0.9 (+/-14.59) 1.88 (+/-24.49) 0.59 (+/-9.63) \(0.003\)
Extra-fees Nurse (n = 6,111) 0.02 (+/-0.53) 0.03 (+/-0.54) 0.02 (+/-0.53) \(0.553\)
Extra-fees Dentist (n = 6,111) 85.26 (+/-348.16) 91.28 (+/-358.95) 83.39 (+/-344.76) \(0.451\)
Extra-fees Equipment (n = 6,111) 1.87 (+/-30.96) 3.35 (+/-57.17) 1.42 (+/-15.57) \(0.039\)
Extra-fees Transport (n = 6,111) 0.43 (+/-16.78) 0.86 (+/-23.17) 0.3 (+/-14.22) \(0.272\)
Extra-fees Optical (n = 6,111) 100.99 (+/-217.77) 97.54 (+/-210.04) 102.06 (+/-220.13) \(0.491\)
Extra-fees Prostheses (n = 6,111) 21.82 (+/-198.24) 31.34 (+/-239.83) 18.86 (+/-183.38) \(0.036\)
Extra-fees Emergency w/o hospitalization (n = 6,111) 0.02 (+/-0.5) 0.02 (+/-0.6) 0.02 (+/-0.46) \(0.927\)
Deduct. Outpatient (n = 6,111) 28.1 (+/-28.82) 36.18 (+/-33.71) 25.59 (+/-26.63) \(< 10^{-3}\)
Deduct. General Practitioner (n = 6,111) 3.94 (+/-4.36) 5.1 (+/-5.46) 3.57 (+/-3.89) \(< 10^{-3}\)
Deduct. Specialist (n = 6,111) 3.61 (+/-4.9) 4.22 (+/-5.49) 3.42 (+/-4.69) \(< 10^{-3}\)
Deduct. Pharmacy (n = 6,111) 13.55 (+/-15.46) 17.28 (+/-17.34) 12.39 (+/-14.63) \(< 10^{-3}\)
Deduct. Physiotherapist (n = 6,111) 1.12 (+/-3.61) 1.52 (+/-4.37) 0.99 (+/-3.33) \(< 10^{-3}\)
Deduct. Nurse (n = 6,111) 0.98 (+/-4.35) 1.68 (+/-6.36) 0.76 (+/-3.47) \(< 10^{-3}\)
Deduct. Dentist (n = 6,111) 0.01 (+/-0.12) 0.01 (+/-0.17) 0 (+/-0.09) \(0.121\)
Deduct. Transport (n = 6,111) 0.31 (+/-1.99) 0.6 (+/-3.04) 0.21 (+/-1.52) \(< 10^{-3}\)
Deduct. Emergency w/o hospitalization (n = 6,111) 0.24 (+/-0.96) 0.28 (+/-1.04) 0.22 (+/-0.93) \(0.039\)
No. Medical Sessions General Pract. (n = 6,111) 4.71 (+/-4.96) 6.38 (+/-6.39) 4.19 (+/-4.3) \(< 10^{-3}\)
No. Medical Sessions Specialist (n = 6,111) 3.45 (+/-4.43) 4.18 (+/-5.03) 3.22 (+/-4.21) \(< 10^{-3}\)
Table 10.6: Healthcare expenditures
ind_soins <- which(str_detect(variable_names$variable, "^SOINS_"))
print_tableau(ind = ind_soins, df = df |> filter(in_sample)) |> 
  kableExtra::kable(format = "html", escape = FALSE) |> 
  kableExtra::kable_classic(full_width = F, html_font = "Cambria") |> 
  kableExtra::kable_styling(
    bootstrap_options = c("striped", "hover", "condensed", "responsive")
  ) |> 
  kableExtra::kable_styling() |>
  unclass() |> cat()
label Whole Sample >Q1 p_value
Long-term condition (SNIIRAM) (n = 5,293) Yes 1019 (19.25%) 357 (28.29%) 662 (16.42%)
Long-term condition (SNIIRAM) No 4274 (80.75%) 905 (71.71%) 3369 (83.58%) \(< 10^{-3}\)
Exp. Outpatient (n = 5,293) 1469.8 (+/-2528.39) 2184.64 (+/-3495.61) 1246 (+/-2088.31) \(< 10^{-3}\)
Exp. General Practitioner (n = 5,293) 125.64 (+/-143.02) 172.04 (+/-178.1) 111.12 (+/-126.69) \(< 10^{-3}\)
Exp. Specialist (n = 5,293) 193.62 (+/-376.86) 231.63 (+/-400.49) 181.72 (+/-368.4) \(< 10^{-3}\)
Exp. Pharmacy (n = 5,293) 468.79 (+/-1473.3) 747.84 (+/-1848.54) 381.43 (+/-1322.53) \(< 10^{-3}\)
Exp. Physiotherapist (n = 5,293) 59.12 (+/-221.51) 104.06 (+/-341.78) 45.05 (+/-164.46) \(< 10^{-3}\)
Exp. Nurse (n = 5,293) 70.77 (+/-620.48) 162.53 (+/-950.81) 42.05 (+/-468.21) \(< 10^{-3}\)
Exp. Dentist (n = 5,293) 164.77 (+/-503.46) 183.48 (+/-561.64) 158.92 (+/-483.74) \(0.13\)
Exp. Equipment (n = 5,293) 80.91 (+/-499.86) 160.72 (+/-738.03) 55.92 (+/-393.76) \(< 10^{-3}\)
Exp. Transport (n = 5,293) 57.56 (+/-610.5) 130.35 (+/-1039.49) 34.78 (+/-386.19) \(< 10^{-3}\)
Exp. Optical (n = 5,293) 104.41 (+/-224.41) 99.8 (+/-215.54) 105.86 (+/-227.12) \(0.403\)
Exp. Prostheses (n = 5,293) 39.27 (+/-248.88) 55.18 (+/-304.39) 34.3 (+/-228.56) \(0.009\)
Exp. Emergency w/o hospitalization (n = 5,293) 14.96 (+/-51.1) 20.39 (+/-61.98) 13.25 (+/-47.06) \(< 10^{-3}\)
Reimbursement Outpatient (n = 5,293) 966.66 (+/-2322.13) 1601.24 (+/-3301.65) 767.99 (+/-1871.99) \(< 10^{-3}\)
Reimbursement General Practitioner (n = 5,293) 89.44 (+/-112.53) 128.66 (+/-146.88) 77.16 (+/-96.15) \(< 10^{-3}\)
Reimbursement Specialist (n = 5,293) 133.15 (+/-301.12) 168.44 (+/-350.45) 122.1 (+/-283.06) \(< 10^{-3}\)
Reimbursement Pharmacy (n = 5,293) 361.5 (+/-1431.61) 605.05 (+/-1784.84) 285.26 (+/-1292.33) \(< 10^{-3}\)
Reimbursement Physiotherapist (n = 5,293) 42.49 (+/-191.39) 80.8 (+/-313.76) 30.5 (+/-129.2) \(< 10^{-3}\)
Reimbursement Nurse (n = 5,293) 64.22 (+/-595.92) 154.55 (+/-944.52) 35.94 (+/-428.75) \(< 10^{-3}\)
Reimbursement Dentist (n = 5,293) 58.64 (+/-135.48) 65.87 (+/-163.77) 56.38 (+/-125.25) \(0.03\)
Reimbursement Equipment (n = 5,293) 69.36 (+/-478.52) 144.46 (+/-711.22) 45.84 (+/-374.29) \(< 10^{-3}\)
Reimbursement Transport (n = 5,293) 54.8 (+/-606.35) 124.75 (+/-1033.53) 32.9 (+/-382.82) \(< 10^{-3}\)
Reimbursement Optical (n = 5,293) 2.63 (+/-6.17) 2.77 (+/-6.21) 2.59 (+/-6.16) \(0.381\)
Reimbursement Prostheses (n = 5,293) 13.65 (+/-109.58) 20.81 (+/-151.56) 11.41 (+/-92.52) \(0.008\)
Reimbursement Emergency w/o hospitalization (n = 5,293) 11.97 (+/-40.47) 16.56 (+/-49.62) 10.53 (+/-37.04) \(< 10^{-3}\)
Co-payment Outpatient (n = 5,293) 236.32 (+/-273.57) 292.93 (+/-323.68) 218.6 (+/-253.33) \(< 10^{-3}\)
Co-payment General Practitioner (n = 5,293) 27.22 (+/-35.42) 32.3 (+/-42.17) 25.63 (+/-32.87) \(< 10^{-3}\)
Co-payment Specialist (n = 5,293) 32.75 (+/-46.61) 36.41 (+/-52.43) 31.6 (+/-44.58) \(0.001\)
Co-payment Pharmacy (n = 5,293) 93.7 (+/-142.51) 125.18 (+/-184.83) 83.85 (+/-124.79) \(< 10^{-3}\)
Co-payment Physiotherapist (n = 5,293) 14.73 (+/-52.04) 19.97 (+/-62.35) 13.09 (+/-48.25) \(< 10^{-3}\)
Co-payment Nurse (n = 5,293) 5.59 (+/-79.13) 6.29 (+/-33.53) 5.37 (+/-88.72) \(0.718\)
Co-payment Dentist (n = 5,293) 21.56 (+/-52.58) 23.52 (+/-60.41) 20.95 (+/-49.87) \(0.13\)
Co-payment Equipment (n = 5,293) 9.56 (+/-58.31) 12.61 (+/-70.33) 8.61 (+/-53.98) \(0.033\)
Co-payment Transport (n = 5,293) 2.05 (+/-22.25) 4.26 (+/-37.12) 1.35 (+/-14.72) \(< 10^{-3}\)
Co-payment Optical (n = 5,293) 1.57 (+/-3.81) 1.58 (+/-3.85) 1.56 (+/-3.8) \(0.871\)
Co-payment Prostheses (n = 5,293) 4.67 (+/-17.96) 5.18 (+/-16.98) 4.51 (+/-18.26) \(0.248\)
Co-payment Emergency w/o hospitalization (n = 5,293) 2.73 (+/-11.51) 3.51 (+/-13.83) 2.48 (+/-10.67) \(0.005\)
Extra-fees Outpatient (n = 5,293) 238.86 (+/-500.81) 254.16 (+/-543.26) 234.07 (+/-486.73) \(0.214\)
Extra-fees General Practitioner (n = 5,293) 5.04 (+/-28.26) 5.99 (+/-32.45) 4.75 (+/-26.82) \(0.171\)
Extra-fees Specialist (n = 5,293) 23.94 (+/-106.01) 22.35 (+/-78.33) 24.43 (+/-113.3) \(0.543\)
Extra-fees Pharmacy (n = 5,293) 0.23 (+/-7.81) 0.35 (+/-8.7) 0.19 (+/-7.51) \(0.517\)
Extra-fees Physiotherapist (n = 5,293) 0.81 (+/-13.9) 1.84 (+/-23.7) 0.49 (+/-8.81) \(0.002\)
Extra-fees Nurse (n = 5,293) 0.02 (+/-0.44) 0.03 (+/-0.57) 0.01 (+/-0.39) \(0.282\)
Extra-fees Dentist (n = 5,293) 84.57 (+/-344.5) 94.09 (+/-369.74) 81.58 (+/-336.2) \(0.26\)
Extra-fees Equipment (n = 5,293) 1.99 (+/-33.16) 3.66 (+/-61.16) 1.47 (+/-16.5) \(0.04\)
Extra-fees Transport (n = 5,293) 0.41 (+/-17.34) 0.71 (+/-22.89) 0.32 (+/-15.19) \(0.478\)
Extra-fees Optical (n = 5,293) 100.21 (+/-217.26) 95.46 (+/-208.63) 101.7 (+/-219.9) \(0.373\)
Extra-fees Prostheses (n = 5,293) 20.96 (+/-189.11) 29.19 (+/-224.4) 18.38 (+/-176.57) \(0.076\)
Extra-fees Emergency w/o hospitalization (n = 5,293) 0.02 (+/-0.51) 0.03 (+/-0.64) 0.02 (+/-0.47) \(0.79\)
Deduct. Outpatient (n = 5,293) 27.76 (+/-28.71) 36.04 (+/-33.85) 25.16 (+/-26.37) \(< 10^{-3}\)
Deduct. General Practitioner (n = 5,293) 3.93 (+/-4.38) 5.07 (+/-5.48) 3.57 (+/-3.9) \(< 10^{-3}\)
Deduct. Specialist (n = 5,293) 3.59 (+/-4.89) 4.17 (+/-5.41) 3.41 (+/-4.7) \(< 10^{-3}\)
Deduct. Pharmacy (n = 5,293) 13.36 (+/-15.38) 17.26 (+/-17.4) 12.14 (+/-14.47) \(< 10^{-3}\)
Deduct. Physiotherapist (n = 5,293) 1.09 (+/-3.54) 1.45 (+/-4.11) 0.98 (+/-3.34) \(< 10^{-3}\)
Deduct. Nurse (n = 5,293) 0.94 (+/-4.13) 1.66 (+/-6.05) 0.72 (+/-3.28) \(< 10^{-3}\)
Deduct. Dentist (n = 5,293) 0 (+/-0.11) 0.01 (+/-0.18) 0 (+/-0.07) \(0.039\)
Deduct. Transport (n = 5,293) 0.31 (+/-2.04) 0.62 (+/-3.14) 0.21 (+/-1.54) \(< 10^{-3}\)
Deduct. Emergency w/o hospitalization (n = 5,293) 0.24 (+/-0.92) 0.29 (+/-1.08) 0.22 (+/-0.86) \(0.009\)
No. Medical Sessions General Pract. (n = 5,293) 4.73 (+/-5.02) 6.44 (+/-6.46) 4.19 (+/-4.34) \(< 10^{-3}\)
No. Medical Sessions Specialist (n = 5,293) 3.44 (+/-4.44) 4.15 (+/-4.97) 3.22 (+/-4.23) \(< 10^{-3}\)
Table 10.7: Working conditions
ind_travail <- which(str_detect(variable_names$variable, "^QST_"))
print_tableau(ind = ind_travail, df = df) |> 
  kableExtra::kable(format = "html", escape = FALSE) |> 
  kableExtra::kable_classic(full_width = F, html_font = "Cambria") |> 
  kableExtra::kable_styling(
    bootstrap_options = c("striped", "hover", "condensed", "responsive")
  ) |> 
  kableExtra::kable_styling() |>
  unclass() |> cat()
label Whole Sample >Q1 p_value
Have to Hurry to Do Job (n = 11,199) Always 834 (7.45%) 231 (9.47%) 603 (6.88%)
Have to Hurry to Do Job Often 1881 (16.8%) 413 (16.93%) 1468 (16.76%)
Have to Hurry to Do Job Sometimes 2155 (19.24%) 336 (13.78%) 1819 (20.76%)
Have to Hurry to Do Job Never 541 (4.83%) 63 (2.58%) 478 (5.46%)
Have to Hurry to Do Job No answer 5788 (51.68%) 1396 (57.24%) 4392 (50.14%) \(< 10^{-3}\)
Very Little Freedom to Do Job (n = 11,199) Always 283 (2.53%) 79 (3.24%) 204 (2.33%)
Very Little Freedom to Do Job Often 695 (6.21%) 189 (7.75%) 506 (5.78%)
Very Little Freedom to Do Job Sometimes 2277 (20.33%) 454 (18.61%) 1823 (20.81%)
Very Little Freedom to Do Job Never 2129 (19.01%) 318 (13.04%) 1811 (20.67%)
Very Little Freedom to Do Job No answer 5815 (51.92%) 1399 (57.36%) 4416 (50.41%) \(< 10^{-3}\)
Job Allows to Learn New Things (n = 11,199) Always 841 (7.51%) 112 (4.59%) 729 (8.32%)
Job Allows to Learn New Things Often 1995 (17.81%) 322 (13.2%) 1673 (19.1%)
Job Allows to Learn New Things Sometimes 2195 (19.6%) 508 (20.83%) 1687 (19.26%)
Job Allows to Learn New Things Never 384 (3.43%) 102 (4.18%) 282 (3.22%)
Job Allows to Learn New Things No answer 5784 (51.65%) 1395 (57.2%) 4389 (50.1%) \(< 10^{-3}\)
Colleagues Help Carry out Tasks (n = 11,199) Always 577 (5.15%) 82 (3.36%) 495 (5.65%)
Colleagues Help Carry out Tasks Often 1640 (14.64%) 259 (10.62%) 1381 (15.76%)
Colleagues Help Carry out Tasks Sometimes 2128 (19%) 465 (19.07%) 1663 (18.98%)
Colleagues Help Carry out Tasks Never 522 (4.66%) 132 (5.41%) 390 (4.45%)
Colleagues Help Carry out Tasks Not concered 518 (4.63%) 96 (3.94%) 422 (4.82%)
Colleagues Help Carry out Tasks No answer 5814 (51.92%) 1405 (57.61%) 4409 (50.33%) \(< 10^{-3}\)
Job Requires not to Sleep Betw. Midnight and 5 a.m. (n = 11,199) Always 139 (1.24%) 30 (1.23%) 109 (1.24%)
Job Requires not to Sleep Betw. Midnight and 5 a.m. Often 212 (1.89%) 31 (1.27%) 181 (2.07%)
Job Requires not to Sleep Betw. Midnight and 5 a.m. Sometimes 530 (4.73%) 112 (4.59%) 418 (4.77%)
Job Requires not to Sleep Betw. Midnight and 5 a.m. Never 4519 (40.35%) 870 (35.67%) 3649 (41.66%)
Job Requires not to Sleep Betw. Midnight and 5 a.m. No answer 5799 (51.78%) 1396 (57.24%) 4403 (50.26%) \(< 10^{-3}\)
Repetitive Work under Time Constraints / Line Job (n = 11,199) Always 408 (3.64%) 99 (4.06%) 309 (3.53%)
Repetitive Work under Time Constraints / Line Job Often 500 (4.46%) 128 (5.25%) 372 (4.25%)
Repetitive Work under Time Constraints / Line Job Sometimes 692 (6.18%) 157 (6.44%) 535 (6.11%)
Repetitive Work under Time Constraints / Line Job Never 3777 (33.73%) 656 (26.9%) 3121 (35.63%)
Repetitive Work under Time Constraints / Line Job No answer 5822 (51.99%) 1399 (57.36%) 4423 (50.49%) \(< 10^{-3}\)
Exposed to Carrying Heavy Loads (n = 11,199) Always 388 (3.46%) 95 (3.9%) 293 (3.34%)
Exposed to Carrying Heavy Loads Often 799 (7.13%) 176 (7.22%) 623 (7.11%)
Exposed to Carrying Heavy Loads Sometimes 1581 (14.12%) 292 (11.97%) 1289 (14.71%)
Exposed to Carrying Heavy Loads Never 2625 (23.44%) 477 (19.56%) 2148 (24.52%)
Exposed to Carrying Heavy Loads No answer 5806 (51.84%) 1399 (57.36%) 4407 (50.31%) \(< 10^{-3}\)
Exposed to Painful Postures (n = 11,199) Always 903 (8.06%) 233 (9.55%) 670 (7.65%)
Exposed to Painful Postures Often 1111 (9.92%) 218 (8.94%) 893 (10.19%)
Exposed to Painful Postures Sometimes 1171 (10.46%) 190 (7.79%) 981 (11.2%)
Exposed to Painful Postures Never 2208 (19.72%) 402 (16.48%) 1806 (20.62%)
Exposed to Painful Postures No answer 5806 (51.84%) 1396 (57.24%) 4410 (50.34%) \(< 10^{-3}\)
Exposed to Harmful/Toxic Products/Substances (n = 11,199) Always 457 (4.08%) 106 (4.35%) 351 (4.01%)
Exposed to Harmful/Toxic Products/Substances Often 719 (6.42%) 156 (6.4%) 563 (6.43%)
Exposed to Harmful/Toxic Products/Substances Sometimes 1254 (11.2%) 215 (8.82%) 1039 (11.86%)
Exposed to Harmful/Toxic Products/Substances Never 2970 (26.52%) 565 (23.17%) 2405 (27.45%)
Exposed to Harmful/Toxic Products/Substances No answer 5799 (51.78%) 1397 (57.28%) 4402 (50.25%) \(< 10^{-3}\)
Table 10.8: Working conditions
ind_travail <- which(str_detect(variable_names$variable, "^QST_"))
print_tableau(ind = ind_travail, df = df |> filter(in_sample)) |> 
  kableExtra::kable(format = "html", escape = FALSE) |> 
  kableExtra::kable_classic(full_width = F, html_font = "Cambria") |> 
  kableExtra::kable_styling(
    bootstrap_options = c("striped", "hover", "condensed", "responsive")
  ) |> 
  kableExtra::kable_styling() |>
  unclass() |> cat()
label Whole Sample >Q1 p_value
Have to Hurry to Do Job (n = 5,293) Always 391 (7.39%) 121 (9.59%) 270 (6.7%)
Have to Hurry to Do Job Often 895 (16.91%) 217 (17.19%) 678 (16.82%)
Have to Hurry to Do Job Sometimes 1016 (19.2%) 148 (11.73%) 868 (21.53%)
Have to Hurry to Do Job Never 247 (4.67%) 28 (2.22%) 219 (5.43%)
Have to Hurry to Do Job No answer 2744 (51.84%) 748 (59.27%) 1996 (49.52%) \(< 10^{-3}\)
Very Little Freedom to Do Job (n = 5,293) Always 126 (2.38%) 39 (3.09%) 87 (2.16%)
Very Little Freedom to Do Job Often 299 (5.65%) 93 (7.37%) 206 (5.11%)
Very Little Freedom to Do Job Sometimes 1084 (20.48%) 227 (17.99%) 857 (21.26%)
Very Little Freedom to Do Job Never 1028 (19.42%) 151 (11.97%) 877 (21.76%)
Very Little Freedom to Do Job No answer 2756 (52.07%) 752 (59.59%) 2004 (49.71%) \(< 10^{-3}\)
Job Allows to Learn New Things (n = 5,293) Always 401 (7.58%) 54 (4.28%) 347 (8.61%)
Job Allows to Learn New Things Often 960 (18.14%) 172 (13.63%) 788 (19.55%)
Job Allows to Learn New Things Sometimes 1039 (19.63%) 241 (19.1%) 798 (19.8%)
Job Allows to Learn New Things Never 151 (2.85%) 47 (3.72%) 104 (2.58%)
Job Allows to Learn New Things No answer 2742 (51.8%) 748 (59.27%) 1994 (49.47%) \(< 10^{-3}\)
Colleagues Help Carry out Tasks (n = 5,293) Always 291 (5.5%) 41 (3.25%) 250 (6.2%)
Colleagues Help Carry out Tasks Often 785 (14.83%) 143 (11.33%) 642 (15.93%)
Colleagues Help Carry out Tasks Sometimes 978 (18.48%) 214 (16.96%) 764 (18.95%)
Colleagues Help Carry out Tasks Never 241 (4.55%) 66 (5.23%) 175 (4.34%)
Colleagues Help Carry out Tasks Not concered 247 (4.67%) 47 (3.72%) 200 (4.96%)
Colleagues Help Carry out Tasks No answer 2751 (51.97%) 751 (59.51%) 2000 (49.62%) \(< 10^{-3}\)
Job Requires not to Sleep Betw. Midnight and 5 a.m. (n = 5,293) Always 61 (1.15%) 12 (0.95%) 49 (1.22%)
Job Requires not to Sleep Betw. Midnight and 5 a.m. Often 91 (1.72%) 13 (1.03%) 78 (1.94%)
Job Requires not to Sleep Betw. Midnight and 5 a.m. Sometimes 254 (4.8%) 63 (4.99%) 191 (4.74%)
Job Requires not to Sleep Betw. Midnight and 5 a.m. Never 2136 (40.36%) 432 (34.23%) 1704 (42.27%)
Job Requires not to Sleep Betw. Midnight and 5 a.m. No answer 2751 (51.97%) 742 (58.8%) 2009 (49.84%) \(< 10^{-3}\)
Repetitive Work under Time Constraints / Line Job (n = 5,293) Always 174 (3.29%) 46 (3.65%) 128 (3.18%)
Repetitive Work under Time Constraints / Line Job Often 227 (4.29%) 58 (4.6%) 169 (4.19%)
Repetitive Work under Time Constraints / Line Job Sometimes 330 (6.23%) 79 (6.26%) 251 (6.23%)
Repetitive Work under Time Constraints / Line Job Never 1809 (34.18%) 336 (26.62%) 1473 (36.54%)
Repetitive Work under Time Constraints / Line Job No answer 2753 (52.01%) 743 (58.87%) 2010 (49.86%) \(< 10^{-3}\)
Exposed to Carrying Heavy Loads (n = 5,293) Always 187 (3.53%) 52 (4.12%) 135 (3.35%)
Exposed to Carrying Heavy Loads Often 392 (7.41%) 94 (7.45%) 298 (7.39%)
Exposed to Carrying Heavy Loads Sometimes 725 (13.7%) 144 (11.41%) 581 (14.41%)
Exposed to Carrying Heavy Loads Never 1237 (23.37%) 228 (18.07%) 1009 (25.03%)
Exposed to Carrying Heavy Loads No answer 2752 (51.99%) 744 (58.95%) 2008 (49.81%) \(< 10^{-3}\)
Exposed to Painful Postures (n = 5,293) Always 409 (7.73%) 120 (9.51%) 289 (7.17%)
Exposed to Painful Postures Often 523 (9.88%) 110 (8.72%) 413 (10.25%)
Exposed to Painful Postures Sometimes 533 (10.07%) 89 (7.05%) 444 (11.01%)
Exposed to Painful Postures Never 1078 (20.37%) 202 (16.01%) 876 (21.73%)
Exposed to Painful Postures No answer 2750 (51.96%) 741 (58.72%) 2009 (49.84%) \(< 10^{-3}\)
Exposed to Harmful/Toxic Products/Substances (n = 5,293) Always 211 (3.99%) 50 (3.96%) 161 (3.99%)
Exposed to Harmful/Toxic Products/Substances Often 335 (6.33%) 75 (5.94%) 260 (6.45%)
Exposed to Harmful/Toxic Products/Substances Sometimes 582 (11%) 112 (8.87%) 470 (11.66%)
Exposed to Harmful/Toxic Products/Substances Never 1415 (26.73%) 281 (22.27%) 1134 (28.13%)
Exposed to Harmful/Toxic Products/Substances No answer 2750 (51.96%) 744 (58.95%) 2006 (49.76%) \(< 10^{-3}\)
Table 10.9: Economic and social situation
ind_autre <- which(str_detect(variable_names$variable, "^QES_"))
print_tableau(ind = ind_autre, df = df) |> 
  kableExtra::kable(format = "html", escape = FALSE) |> 
  kableExtra::kable_classic(full_width = F, html_font = "Cambria") |> 
  kableExtra::kable_styling(
    bootstrap_options = c("striped", "hover", "condensed", "responsive")
  ) |> 
  kableExtra::kable_styling() |>
  unclass() |> cat()
label Whole Sample >Q1 p_value
Participation in Group Activities (n = 11,199) Yes 3784 (33.79%) 660 (27.06%) 3124 (35.66%)
Participation in Group Activities No 7179 (64.1%) 1713 (70.23%) 5466 (62.4%)
Participation in Group Activities No answer 236 (2.11%) 66 (2.71%) 170 (1.94%) \(< 10^{-3}\)
Frequency Meeting with Friends/Neighbors (n = 11,199) Every day or almost every day 2531 (22.6%) 454 (18.61%) 2077 (23.71%)
Frequency Meeting with Friends/Neighbors At least once a week 4464 (39.86%) 906 (37.15%) 3558 (40.62%)
Frequency Meeting with Friends/Neighbors At least once a month 2333 (20.83%) 511 (20.95%) 1822 (20.8%)
Frequency Meeting with Friends/Neighbors Less than once a month 1018 (9.09%) 290 (11.89%) 728 (8.31%)
Frequency Meeting with Friends/Neighbors Never 553 (4.94%) 196 (8.04%) 357 (4.08%)
Frequency Meeting with Friends/Neighbors No answer 300 (2.68%) 82 (3.36%) 218 (2.49%) \(< 10^{-3}\)
Frequency Meeting with People in Organizations (n = 11,198) Every day or almost every day 303 (2.71%) 68 (2.79%) 235 (2.68%)
Frequency Meeting with People in Organizations At least once a week 1898 (16.95%) 335 (13.74%) 1563 (17.84%)
Frequency Meeting with People in Organizations At least once a month 1257 (11.23%) 234 (9.6%) 1023 (11.68%)
Frequency Meeting with People in Organizations Less than once a month 1314 (11.73%) 254 (10.42%) 1060 (12.1%)
Frequency Meeting with People in Organizations Never 5903 (52.71%) 1406 (57.67%) 4497 (51.34%)
Frequency Meeting with People in Organizations No answer 523 (4.67%) 141 (5.78%) 382 (4.36%) \(< 10^{-3}\)
Frequency Meeting with Colleagues Outside Work (n = 11,199) Every day or almost every day 628 (5.61%) 98 (4.02%) 530 (6.05%)
Frequency Meeting with Colleagues Outside Work At least once a week 1060 (9.47%) 210 (8.61%) 850 (9.7%)
Frequency Meeting with Colleagues Outside Work At least once a month 1463 (13.06%) 259 (10.62%) 1204 (13.74%)
Frequency Meeting with Colleagues Outside Work Less than once a month 2189 (19.55%) 393 (16.11%) 1796 (20.5%)
Frequency Meeting with Colleagues Outside Work Never 4795 (42.82%) 1229 (50.39%) 3566 (40.71%)
Frequency Meeting with Colleagues Outside Work No answer 1064 (9.5%) 250 (10.25%) 814 (9.29%) \(< 10^{-3}\)
Frequency Meeting with Family Living Outside Household (n = 11,199) Every day or almost every day 2132 (19.04%) 477 (19.56%) 1655 (18.89%)
Frequency Meeting with Family Living Outside Household At least once a week 4137 (36.94%) 833 (34.15%) 3304 (37.72%)
Frequency Meeting with Family Living Outside Household At least once a month 2561 (22.87%) 516 (21.16%) 2045 (23.34%)
Frequency Meeting with Family Living Outside Household Less than once a month 1626 (14.52%) 380 (15.58%) 1246 (14.22%)
Frequency Meeting with Family Living Outside Household Never 406 (3.63%) 139 (5.7%) 267 (3.05%)
Frequency Meeting with Family Living Outside Household No answer 337 (3.01%) 94 (3.85%) 243 (2.77%) \(< 10^{-3}\)
Mother’s Level of Education (n = 11,199) Never Been to School 703 (6.28%) 233 (9.55%) 470 (5.37%)
Mother’s Level of Education Nursery School, Primary school, Certificate of studies 4049 (36.16%) 903 (37.02%) 3146 (35.91%)
Mother’s Level of Education 1st cycle (~Middle School) 2164 (19.32%) 402 (16.48%) 1762 (20.11%)
Mother’s Level of Education 2nd cycle (~High School 1064 (9.5%) 187 (7.67%) 877 (10.01%)
Mother’s Level of Education Higher Education 1100 (9.82%) 197 (8.08%) 903 (10.31%)
Mother’s Level of Education Other 168 (1.5%) 25 (1.03%) 143 (1.63%)
Mother’s Level of Education Does not know 1723 (15.39%) 431 (17.67%) 1292 (14.75%)
Mother’s Level of Education No answer 228 (2.04%) 61 (2.5%) 167 (1.91%) \(< 10^{-3}\)
Father’s Level of Education (n = 11,199) Never Been to School 583 (5.21%) 199 (8.16%) 384 (4.38%)
Father’s Level of Education Nursery School, Primary school, Certificate of studies 3651 (32.6%) 808 (33.13%) 2843 (32.45%)
Father’s Level of Education 1st cycle (~Middle School) 2382 (21.27%) 432 (17.71%) 1950 (22.26%)
Father’s Level of Education 2nd cycle (~High School 853 (7.62%) 153 (6.27%) 700 (7.99%)
Father’s Level of Education Higher Education 1324 (11.82%) 245 (10.05%) 1079 (12.32%)
Father’s Level of Education Other 248 (2.21%) 58 (2.38%) 190 (2.17%)
Father’s Level of Education Does not know 1921 (17.15%) 486 (19.93%) 1435 (16.38%)
Father’s Level of Education No answer 237 (2.12%) 58 (2.38%) 179 (2.04%) \(< 10^{-3}\)
Table 10.10: Economic and social situation
ind_autre <- which(str_detect(variable_names$variable, "^QES_"))
print_tableau(ind = ind_autre, df = df |> filter(in_sample)) |> 
  kableExtra::kable(format = "html", escape = FALSE) |> 
  kableExtra::kable_classic(full_width = F, html_font = "Cambria") |> 
  kableExtra::kable_styling(
    bootstrap_options = c("striped", "hover", "condensed", "responsive")
  ) |> 
  kableExtra::kable_styling() |>
  unclass() |> cat()
label Whole Sample >Q1 p_value
Participation in Group Activities (n = 5,293) Yes 1848 (34.91%) 359 (28.45%) 1489 (36.94%)
Participation in Group Activities No 3337 (63.05%) 876 (69.41%) 2461 (61.05%)
Participation in Group Activities No answer 108 (2.04%) 27 (2.14%) 81 (2.01%) \(< 10^{-3}\)
Frequency Meeting with Friends/Neighbors (n = 5,293) Every day or almost every day 1144 (21.61%) 236 (18.7%) 908 (22.53%)
Frequency Meeting with Friends/Neighbors At least once a week 2150 (40.62%) 475 (37.64%) 1675 (41.55%)
Frequency Meeting with Friends/Neighbors At least once a month 1098 (20.74%) 253 (20.05%) 845 (20.96%)
Frequency Meeting with Friends/Neighbors Less than once a month 497 (9.39%) 149 (11.81%) 348 (8.63%)
Frequency Meeting with Friends/Neighbors Never 270 (5.1%) 110 (8.72%) 160 (3.97%)
Frequency Meeting with Friends/Neighbors No answer 134 (2.53%) 39 (3.09%) 95 (2.36%) \(< 10^{-3}\)
Frequency Meeting with People in Organizations (n = 5,293) Every day or almost every day 161 (3.04%) 43 (3.41%) 118 (2.93%)
Frequency Meeting with People in Organizations At least once a week 912 (17.23%) 174 (13.79%) 738 (18.31%)
Frequency Meeting with People in Organizations At least once a month 604 (11.41%) 115 (9.11%) 489 (12.13%)
Frequency Meeting with People in Organizations Less than once a month 657 (12.41%) 141 (11.17%) 516 (12.8%)
Frequency Meeting with People in Organizations Never 2717 (51.33%) 723 (57.29%) 1994 (49.47%)
Frequency Meeting with People in Organizations No answer 242 (4.57%) 66 (5.23%) 176 (4.37%) \(< 10^{-3}\)
Frequency Meeting with Colleagues Outside Work (n = 5,293) Every day or almost every day 275 (5.2%) 50 (3.96%) 225 (5.58%)
Frequency Meeting with Colleagues Outside Work At least once a week 446 (8.43%) 100 (7.92%) 346 (8.58%)
Frequency Meeting with Colleagues Outside Work At least once a month 670 (12.66%) 127 (10.06%) 543 (13.47%)
Frequency Meeting with Colleagues Outside Work Less than once a month 1032 (19.5%) 207 (16.4%) 825 (20.47%)
Frequency Meeting with Colleagues Outside Work Never 2374 (44.85%) 649 (51.43%) 1725 (42.79%)
Frequency Meeting with Colleagues Outside Work No answer 496 (9.37%) 129 (10.22%) 367 (9.1%) \(< 10^{-3}\)
Frequency Meeting with Family Living Outside Household (n = 5,293) Every day or almost every day 1022 (19.31%) 235 (18.62%) 787 (19.52%)
Frequency Meeting with Family Living Outside Household At least once a week 1969 (37.2%) 434 (34.39%) 1535 (38.08%)
Frequency Meeting with Family Living Outside Household At least once a month 1157 (21.86%) 252 (19.97%) 905 (22.45%)
Frequency Meeting with Family Living Outside Household Less than once a month 783 (14.79%) 211 (16.72%) 572 (14.19%)
Frequency Meeting with Family Living Outside Household Never 208 (3.93%) 78 (6.18%) 130 (3.23%)
Frequency Meeting with Family Living Outside Household No answer 154 (2.91%) 52 (4.12%) 102 (2.53%) \(< 10^{-3}\)
Mother’s Level of Education (n = 5,293) Never Been to School 355 (6.71%) 126 (9.98%) 229 (5.68%)
Mother’s Level of Education Nursery School, Primary school, Certificate of studies 1996 (37.71%) 469 (37.16%) 1527 (37.88%)
Mother’s Level of Education 1st cycle (~Middle School) 968 (18.29%) 199 (15.77%) 769 (19.08%)
Mother’s Level of Education 2nd cycle (~High School 458 (8.65%) 88 (6.97%) 370 (9.18%)
Mother’s Level of Education Higher Education 478 (9.03%) 103 (8.16%) 375 (9.3%)
Mother’s Level of Education Other 82 (1.55%) 10 (0.79%) 72 (1.79%)
Mother’s Level of Education Does not know 857 (16.19%) 241 (19.1%) 616 (15.28%)
Mother’s Level of Education No answer 99 (1.87%) 26 (2.06%) 73 (1.81%) \(< 10^{-3}\)
Father’s Level of Education (n = 5,293) Never Been to School 292 (5.52%) 107 (8.48%) 185 (4.59%)
Father’s Level of Education Nursery School, Primary school, Certificate of studies 1830 (34.57%) 434 (34.39%) 1396 (34.63%)
Father’s Level of Education 1st cycle (~Middle School) 1037 (19.59%) 205 (16.24%) 832 (20.64%)
Father’s Level of Education 2nd cycle (~High School 401 (7.58%) 75 (5.94%) 326 (8.09%)
Father’s Level of Education Higher Education 565 (10.67%) 122 (9.67%) 443 (10.99%)
Father’s Level of Education Other 123 (2.32%) 34 (2.69%) 89 (2.21%)
Father’s Level of Education Does not know 948 (17.91%) 255 (20.21%) 693 (17.19%)
Father’s Level of Education No answer 97 (1.83%) 30 (2.38%) 67 (1.66%) \(< 10^{-3}\)
Table 10.11: Opinion
ind_opinion_1 <- which(str_detect(variable_names$variable, "^OPINION1_"))
print_tableau(ind = ind_opinion_1, df = df) |> 
  kableExtra::kable(format = "html", escape = FALSE) |> 
  kableExtra::kable_classic(full_width = F, html_font = "Cambria") |> 
  kableExtra::kable_styling(
    bootstrap_options = c("striped", "hover", "condensed", "responsive")
  ) |> 
  kableExtra::kable_styling() |>
  unclass() |> cat()
label Whole Sample >Q1 p_value
Waiver General Practitioner (n = 11,199) Yes 239 (2.13%) 103 (4.22%) 136 (1.55%)
Waiver General Practitioner No 5169 (46.16%) 1206 (49.45%) 3963 (45.24%)
Waiver General Practitioner No answer 5791 (51.71%) 1130 (46.33%) 4661 (53.21%) \(< 10^{-3}\)
Waiver Dental Care (n = 11,199) Yes 874 (7.8%) 305 (12.51%) 569 (6.5%)
Waiver Dental Care No 4534 (40.49%) 1004 (41.16%) 3530 (40.3%)
Waiver Dental Care No answer 5791 (51.71%) 1130 (46.33%) 4661 (53.21%) \(< 10^{-3}\)
Waiver Other Health Care (n = 11,199) Yes 216 (1.93%) 87 (3.57%) 129 (1.47%)
Waiver Other Health Care No 5192 (46.36%) 1222 (50.1%) 3970 (45.32%)
Waiver Other Health Care No answer 5791 (51.71%) 1130 (46.33%) 4661 (53.21%) \(< 10^{-3}\)
Waiver Health Care Too Far (n = 11,199) Yes 146 (1.3%) 70 (2.87%) 76 (0.87%)
Waiver Health Care Too Far No 5262 (46.99%) 1239 (50.8%) 4023 (45.92%)
Waiver Health Care Too Far No answer 5791 (51.71%) 1130 (46.33%) 4661 (53.21%) \(< 10^{-3}\)
Waiver Appointment Delay Too Long (n = 11,199) Yes 844 (7.54%) 269 (11.03%) 575 (6.56%)
Waiver Appointment Delay Too Long No 4564 (40.75%) 1040 (42.64%) 3524 (40.23%)
Waiver Appointment Delay Too Long No answer 5791 (51.71%) 1130 (46.33%) 4661 (53.21%) \(< 10^{-3}\)
Table 10.12: Opinion
ind_opinion_1 <- which(str_detect(variable_names$variable, "^OPINION1_"))
print_tableau(ind = ind_opinion_1, df = df |> filter(in_sample)) |> 
  kableExtra::kable(format = "html", escape = FALSE) |> 
  kableExtra::kable_classic(full_width = F, html_font = "Cambria") |> 
  kableExtra::kable_styling(
    bootstrap_options = c("striped", "hover", "condensed", "responsive")
  ) |> 
  kableExtra::kable_styling() |>
  unclass() |> cat()
label Whole Sample >Q1 p_value
Waiver General Practitioner (n = 5,293) Yes 188 (3.55%) 87 (6.89%) 101 (2.51%)
Waiver General Practitioner No 4024 (76.02%) 941 (74.56%) 3083 (76.48%)
Waiver General Practitioner No answer 1081 (20.42%) 234 (18.54%) 847 (21.01%) \(< 10^{-3}\)
Waiver Dental Care (n = 5,293) Yes 695 (13.13%) 255 (20.21%) 440 (10.92%)
Waiver Dental Care No 3517 (66.45%) 773 (61.25%) 2744 (68.07%)
Waiver Dental Care No answer 1081 (20.42%) 234 (18.54%) 847 (21.01%) \(< 10^{-3}\)
Waiver Other Health Care (n = 5,293) Yes 169 (3.19%) 73 (5.78%) 96 (2.38%)
Waiver Other Health Care No 4043 (76.38%) 955 (75.67%) 3088 (76.61%)
Waiver Other Health Care No answer 1081 (20.42%) 234 (18.54%) 847 (21.01%) \(< 10^{-3}\)
Waiver Health Care Too Far (n = 5,293) Yes 100 (1.89%) 53 (4.2%) 47 (1.17%)
Waiver Health Care Too Far No 4112 (77.69%) 975 (77.26%) 3137 (77.82%)
Waiver Health Care Too Far No answer 1081 (20.42%) 234 (18.54%) 847 (21.01%) \(< 10^{-3}\)
Waiver Appointment Delay Too Long (n = 5,293) Yes 632 (11.94%) 210 (16.64%) 422 (10.47%)
Waiver Appointment Delay Too Long No 3580 (67.64%) 818 (64.82%) 2762 (68.52%)
Waiver Appointment Delay Too Long No answer 1081 (20.42%) 234 (18.54%) 847 (21.01%) \(< 10^{-3}\)

10.3 Differences with Definition Made Using MHI-5

Let us have a look at the observations that were labelled as “Healthy” or “Imaginary Healthy” when relying on the MHI-5 for which the labelled has changed when using the MHI-3 instead.

First, we load the MHI-5 cleansed data:

load_clean <- function() {
  load("../data/df_clean.rda")
  df_clean
}
df_clean_mhi5 <- load_clean()

Then, we compare the target variable:

df_clean_mhi5 <- 
  df_clean_mhi5 |> 
  left_join(
    df_clean |> 
      select(id, status_with_mhi3 = status),
    by = "id"
  ) |> 
  mutate(
    same_status = case_when(
      status == status_with_mhi3 ~ "Same",
      status == "Not_D_and_sup_Q1" & status_with_mhi3 == "Not_D_and_inf_Q1" ~
        "Healthy (MHI-5) & Imaginary (MHI-3)",
      status == "Not_D_and_inf_Q1" & status_with_mhi3 == "Not_D_and_sup_Q1" ~
        "Imaginary (MHI-5) & Healthy (MHI-3)",
      TRUE ~ "Other"
    )
  )

The number of observations that remained with the same label or for which the latter has changed:

count(df_clean_mhi5, same_status)
# A tibble: 3 × 2
  same_status                             n
  <chr>                               <int>
1 Healthy (MHI-5) & Imaginary (MHI-3)    84
2 Imaginary (MHI-5) & Healthy (MHI-3)   419
3 Same                                 4790

Now, we can, one again, get some descriptive statistics on multiple samples: the entire sample, the one with the individuals which remained the same in both definitions of the target variable, the one in which the individuals were classified as Healthy using the MHI-5 but Imaginary Healthy using the MHI-3, and the individuals were classified as Imaginary Healthy using the MHI-5 but Healthy using the MHI-3.

df_2 <- 
  df |> 
  left_join(
    df_clean_mhi5 |> select(id, same_status)
  )
Joining with `by = join_by(id)`

10.3.1 Tables

Table 10.13: Personnal characteristics
ind_personnes <- which(str_detect(variable_names$variable, "^PERSONNE_"))
print_tableau(ind = ind_personnes[-1], df = df_2, grouping_var = "same_status") |> 
  kableExtra::kable(format = "html", escape = FALSE) |> 
  kableExtra::kable_classic(full_width = F, html_font = "Cambria") |> 
  kableExtra::kable_styling(
    bootstrap_options = c("striped", "hover", "condensed", "responsive")
  ) |> 
  kableExtra::kable_styling() |>
  unclass() |> cat()
label Whole Sample Healthy (MHI-5) & Imaginary (MHI-3) Imaginary (MHI-5) & Healthy (MHI-3) Same p_value
Asthma (n = 5,293) No 4934 (93.22%) 77 (91.67%) 391 (93.32%) 4466 (93.24%)
Asthma Yes 359 (6.78%) 7 (8.33%) 28 (6.68%) 324 (6.76%) \(0.848\)
Bronchitis (n = 5,293) No 4987 (94.22%) 75 (89.29%) 395 (94.27%) 4517 (94.3%)
Bronchitis Yes 306 (5.78%) 9 (10.71%) 24 (5.73%) 273 (5.7%) \(0.149\)
Heart Attack (n = 5,293) No 5259 (99.36%) 83 (98.81%) 415 (99.05%) 4761 (99.39%)
Heart Attack Yes 34 (0.64%) 1 (1.19%) 4 (0.95%) 29 (0.61%) \(0.566\)
Artery Disease (n = 5,293) No 5190 (98.05%) 79 (94.05%) 411 (98.09%) 4700 (98.12%)
Artery Disease Yes 103 (1.95%) 5 (5.95%) 8 (1.91%) 90 (1.88%) \(0.028\)
Hypertension (n = 5,293) No 4662 (88.08%) 65 (77.38%) 351 (83.77%) 4246 (88.64%)
Hypertension Yes 631 (11.92%) 19 (22.62%) 68 (16.23%) 544 (11.36%) \(< 10^{-3}\)
Stroke (n = 5,293) No 5265 (99.47%) 82 (97.62%) 416 (99.28%) 4767 (99.52%)
Stroke Yes 28 (0.53%) 2 (2.38%) 3 (0.72%) 23 (0.48%) \(0.051\)
Osteoarthritis (n = 5,293) No 4586 (86.64%) 69 (82.14%) 349 (83.29%) 4168 (87.01%)
Osteoarthritis Yes 707 (13.36%) 15 (17.86%) 70 (16.71%) 622 (12.99%) \(0.047\)
Low Back Pain (n = 5,293) No 4215 (79.63%) 65 (77.38%) 304 (72.55%) 3846 (80.29%)
Low Back Pain Yes 1078 (20.37%) 19 (22.62%) 115 (27.45%) 944 (19.71%) \(< 10^{-3}\)
Neck Pain (n = 5,293) No 4519 (85.38%) 74 (88.1%) 335 (79.95%) 4110 (85.8%)
Neck Pain Yes 774 (14.62%) 10 (11.9%) 84 (20.05%) 680 (14.2%) \(0.004\)
Diabetes (n = 5,293) No 4848 (91.59%) 76 (90.48%) 382 (91.17%) 4390 (91.65%)
Diabetes Yes 445 (8.41%) 8 (9.52%) 37 (8.83%) 400 (8.35%) \(0.881\)
Allergy (n = 5,293) No 4520 (85.4%) 75 (89.29%) 317 (75.66%) 4128 (86.18%)
Allergy Yes 773 (14.6%) 9 (10.71%) 102 (24.34%) 662 (13.82%) \(< 10^{-3}\)
Cirrhosis (n = 5,293) No 5286 (99.87%) 84 (100%) 418 (99.76%) 4784 (99.87%)
Cirrhosis Yes 7 (0.13%) 0 (0.00%) 1 (0.24%) 6 (0.13%) \(0.783\)
Urinary Incontinence (n = 5,293) No 5071 (95.81%) 77 (91.67%) 400 (95.47%) 4594 (95.91%)
Urinary Incontinence Yes 222 (4.19%) 7 (8.33%) 19 (4.53%) 196 (4.09%) \(0.148\)
MHI-5 Score (n = 5,293) 69.97 (+/-17.93) 66.02 (+/-2.49) 57.55 (+/-3.69) 71.13 (+/-18.41) \(< 10^{-3}\)
Self-Assessed Health Condition (n = 5,293) Not reported 22 (0.42%) 1 (1.19%) 0 (0.00%) 21 (0.44%)
Self-Assessed Health Condition Very Bad or Bad 344 (6.5%) 9 (10.71%) 24 (5.73%) 311 (6.49%)
Self-Assessed Health Condition Very Good, Good or Fairly Good 4927 (93.09%) 74 (88.1%) 395 (94.27%) 4458 (93.07%) \(0.2\)
Age (n = 5,293) 48.7 (+/-18.58) 55.12 (+/-21.94) 48.29 (+/-17.47) 48.62 (+/-18.59) \(0.006\)
Gender (n = 5,293) Female 2765 (52.24%) 45 (53.57%) 239 (57.04%) 2481 (51.8%)
Gender Male 2528 (47.76%) 39 (46.43%) 180 (42.96%) 2309 (48.2%) \(0.116\)
Couple (n = 5,293) No 1830 (34.57%) 44 (52.38%) 142 (33.89%) 1644 (34.32%)
Couple Yes 3463 (65.43%) 40 (47.62%) 277 (66.11%) 3146 (65.68%) \(0.002\)
Marital Status (n = 5,235) Married, Civil Union 2861 (54.65%) 31 (36.9%) 225 (53.96%) 2605 (55.03%)
Marital Status Divorced, separated 437 (8.35%) 6 (7.14%) 43 (10.31%) 388 (8.2%)
Marital Status Widowed 336 (6.42%) 16 (19.05%) 19 (4.56%) 301 (6.36%)
Marital Status Lives in a marriage or concubinage 600 (11.46%) 9 (10.71%) 52 (12.47%) 539 (11.39%)
Marital Status Single 996 (19.03%) 22 (26.19%) 78 (18.71%) 896 (18.93%)
Marital Status Does not know 1 (0.02%) 0 (0.00%) 0 (0.00%) 1 (0.02%)
Marital Status Refuses to answer 4 (0.08%) 0 (0.00%) 0 (0.00%) 4 (0.08%) \(< 10^{-3}\)
Professional Status (n = 5,293) Public employee 854 (16.13%) 10 (11.9%) 66 (15.75%) 778 (16.24%)
Professional Status Private employee 3153 (59.57%) 56 (66.67%) 267 (63.72%) 2830 (59.08%)
Professional Status Other 737 (13.92%) 7 (8.33%) 56 (13.37%) 674 (14.07%)
Professional Status No answer 549 (10.37%) 11 (13.1%) 30 (7.16%) 508 (10.61%) \(0.117\)
Social Security (n = 5,293) Yes (own) 4554 (86.04%) 67 (79.76%) 373 (89.02%) 4114 (85.89%)
Social Security Yes (third party) 739 (13.96%) 17 (20.24%) 46 (10.98%) 676 (14.11%) \(0.051\)
Social Security System (n = 5,293) The general scheme (Cnamts) 3959 (74.8%) 65 (77.38%) 316 (75.42%) 3578 (74.7%)
Social Security System Public service 294 (5.55%) 5 (5.95%) 20 (4.77%) 269 (5.62%)
Social Security System The local Alsace-Moselle scheme 187 (3.53%) 3 (3.57%) 17 (4.06%) 167 (3.49%)
Social Security System The basic Universal Health Coverage 151 (2.85%) 1 (1.19%) 21 (5.01%) 129 (2.69%)
Social Security System The agricultural scheme 340 (6.42%) 6 (7.14%) 20 (4.77%) 314 (6.56%)
Social Security System The self-employed scheme 338 (6.39%) 4 (4.76%) 23 (5.49%) 311 (6.49%)
Social Security System Other (Student, abroad, other) 19 (0.36%) 0 (0.00%) 2 (0.48%) 17 (0.35%)
Social Security System Does not know 5 (0.09%) 0 (0.00%) 0 (0.00%) 5 (0.1%) \(0.527\)
Occupation (n = 5,293) Farmer 160 (3.02%) 1 (1.19%) 10 (2.39%) 149 (3.11%)
Occupation Craftsman, trader 292 (5.52%) 5 (5.95%) 24 (5.73%) 263 (5.49%)
Occupation Executive and intellectual profession 745 (14.08%) 6 (7.14%) 57 (13.6%) 682 (14.24%)
Occupation Intermediate occupation 931 (17.59%) 9 (10.71%) 67 (15.99%) 855 (17.85%)
Occupation Administrative employee 713 (13.47%) 11 (13.1%) 63 (15.04%) 639 (13.34%)
Occupation Commercial employee 650 (12.28%) 14 (16.67%) 57 (13.6%) 579 (12.09%)
Occupation Skilled worker 824 (15.57%) 14 (16.67%) 65 (15.51%) 745 (15.55%)
Occupation Unskilled worker 418 (7.9%) 12 (14.29%) 45 (10.74%) 361 (7.54%)
Occupation Inactive having never worked 560 (10.58%) 12 (14.29%) 31 (7.4%) 517 (10.79%) \(0.062\)
Long-term condition (Self-declared) (n = 5,293) Yes 1018 (19.23%) 27 (32.14%) 87 (20.76%) 904 (18.87%)
Long-term condition (Self-declared) No 4262 (80.52%) 57 (67.86%) 330 (78.76%) 3875 (80.9%)
Long-term condition (Self-declared) Does not know 13 (0.25%) 0 (0.00%) 2 (0.48%) 11 (0.23%) \(0.024\)
Table 10.14: Personnal characteristics
ind_personnes <- which(str_detect(variable_names$variable, "^PERSONNE_"))
# variable_names |> slice(ind_personnes)
print_tableau(
  ind = ind_personnes[-1], df = df_2 |> filter(in_sample), 
  grouping_var = "same_status") |> 
  kableExtra::kable(format = "html", escape = FALSE) |> 
  kableExtra::kable_classic(full_width = F, html_font = "Cambria") |> 
  kableExtra::kable_styling(
    bootstrap_options = c("striped", "hover", "condensed", "responsive")
  ) |> 
  kableExtra::kable_styling() |>
  unclass() |> cat()
label Whole Sample Healthy (MHI-5) & Imaginary (MHI-3) Imaginary (MHI-5) & Healthy (MHI-3) Same p_value
Asthma (n = 5,293) No 4934 (93.22%) 77 (91.67%) 391 (93.32%) 4466 (93.24%)
Asthma Yes 359 (6.78%) 7 (8.33%) 28 (6.68%) 324 (6.76%) \(0.848\)
Bronchitis (n = 5,293) No 4987 (94.22%) 75 (89.29%) 395 (94.27%) 4517 (94.3%)
Bronchitis Yes 306 (5.78%) 9 (10.71%) 24 (5.73%) 273 (5.7%) \(0.149\)
Heart Attack (n = 5,293) No 5259 (99.36%) 83 (98.81%) 415 (99.05%) 4761 (99.39%)
Heart Attack Yes 34 (0.64%) 1 (1.19%) 4 (0.95%) 29 (0.61%) \(0.566\)
Artery Disease (n = 5,293) No 5190 (98.05%) 79 (94.05%) 411 (98.09%) 4700 (98.12%)
Artery Disease Yes 103 (1.95%) 5 (5.95%) 8 (1.91%) 90 (1.88%) \(0.028\)
Hypertension (n = 5,293) No 4662 (88.08%) 65 (77.38%) 351 (83.77%) 4246 (88.64%)
Hypertension Yes 631 (11.92%) 19 (22.62%) 68 (16.23%) 544 (11.36%) \(< 10^{-3}\)
Stroke (n = 5,293) No 5265 (99.47%) 82 (97.62%) 416 (99.28%) 4767 (99.52%)
Stroke Yes 28 (0.53%) 2 (2.38%) 3 (0.72%) 23 (0.48%) \(0.051\)
Osteoarthritis (n = 5,293) No 4586 (86.64%) 69 (82.14%) 349 (83.29%) 4168 (87.01%)
Osteoarthritis Yes 707 (13.36%) 15 (17.86%) 70 (16.71%) 622 (12.99%) \(0.047\)
Low Back Pain (n = 5,293) No 4215 (79.63%) 65 (77.38%) 304 (72.55%) 3846 (80.29%)
Low Back Pain Yes 1078 (20.37%) 19 (22.62%) 115 (27.45%) 944 (19.71%) \(< 10^{-3}\)
Neck Pain (n = 5,293) No 4519 (85.38%) 74 (88.1%) 335 (79.95%) 4110 (85.8%)
Neck Pain Yes 774 (14.62%) 10 (11.9%) 84 (20.05%) 680 (14.2%) \(0.004\)
Diabetes (n = 5,293) No 4848 (91.59%) 76 (90.48%) 382 (91.17%) 4390 (91.65%)
Diabetes Yes 445 (8.41%) 8 (9.52%) 37 (8.83%) 400 (8.35%) \(0.881\)
Allergy (n = 5,293) No 4520 (85.4%) 75 (89.29%) 317 (75.66%) 4128 (86.18%)
Allergy Yes 773 (14.6%) 9 (10.71%) 102 (24.34%) 662 (13.82%) \(< 10^{-3}\)
Cirrhosis (n = 5,293) No 5286 (99.87%) 84 (100%) 418 (99.76%) 4784 (99.87%)
Cirrhosis Yes 7 (0.13%) 0 (0.00%) 1 (0.24%) 6 (0.13%) \(0.783\)
Urinary Incontinence (n = 5,293) No 5071 (95.81%) 77 (91.67%) 400 (95.47%) 4594 (95.91%)
Urinary Incontinence Yes 222 (4.19%) 7 (8.33%) 19 (4.53%) 196 (4.09%) \(0.148\)
MHI-5 Score (n = 5,293) 69.97 (+/-17.93) 66.02 (+/-2.49) 57.55 (+/-3.69) 71.13 (+/-18.41) \(< 10^{-3}\)
Self-Assessed Health Condition (n = 5,293) Not reported 22 (0.42%) 1 (1.19%) 0 (0.00%) 21 (0.44%)
Self-Assessed Health Condition Very Bad or Bad 344 (6.5%) 9 (10.71%) 24 (5.73%) 311 (6.49%)
Self-Assessed Health Condition Very Good, Good or Fairly Good 4927 (93.09%) 74 (88.1%) 395 (94.27%) 4458 (93.07%) \(0.2\)
Age (n = 5,293) 48.7 (+/-18.58) 55.12 (+/-21.94) 48.29 (+/-17.47) 48.62 (+/-18.59) \(0.006\)
Gender (n = 5,293) Female 2765 (52.24%) 45 (53.57%) 239 (57.04%) 2481 (51.8%)
Gender Male 2528 (47.76%) 39 (46.43%) 180 (42.96%) 2309 (48.2%) \(0.116\)
Couple (n = 5,293) No 1830 (34.57%) 44 (52.38%) 142 (33.89%) 1644 (34.32%)
Couple Yes 3463 (65.43%) 40 (47.62%) 277 (66.11%) 3146 (65.68%) \(0.002\)
Marital Status (n = 5,235) Married, Civil Union 2861 (54.65%) 31 (36.9%) 225 (53.96%) 2605 (55.03%)
Marital Status Divorced, separated 437 (8.35%) 6 (7.14%) 43 (10.31%) 388 (8.2%)
Marital Status Widowed 336 (6.42%) 16 (19.05%) 19 (4.56%) 301 (6.36%)
Marital Status Lives in a marriage or concubinage 600 (11.46%) 9 (10.71%) 52 (12.47%) 539 (11.39%)
Marital Status Single 996 (19.03%) 22 (26.19%) 78 (18.71%) 896 (18.93%)
Marital Status Does not know 1 (0.02%) 0 (0.00%) 0 (0.00%) 1 (0.02%)
Marital Status Refuses to answer 4 (0.08%) 0 (0.00%) 0 (0.00%) 4 (0.08%) \(< 10^{-3}\)
Professional Status (n = 5,293) Public employee 854 (16.13%) 10 (11.9%) 66 (15.75%) 778 (16.24%)
Professional Status Private employee 3153 (59.57%) 56 (66.67%) 267 (63.72%) 2830 (59.08%)
Professional Status Other 737 (13.92%) 7 (8.33%) 56 (13.37%) 674 (14.07%)
Professional Status No answer 549 (10.37%) 11 (13.1%) 30 (7.16%) 508 (10.61%) \(0.117\)
Social Security (n = 5,293) Yes (own) 4554 (86.04%) 67 (79.76%) 373 (89.02%) 4114 (85.89%)
Social Security Yes (third party) 739 (13.96%) 17 (20.24%) 46 (10.98%) 676 (14.11%) \(0.051\)
Social Security System (n = 5,293) The general scheme (Cnamts) 3959 (74.8%) 65 (77.38%) 316 (75.42%) 3578 (74.7%)
Social Security System Public service 294 (5.55%) 5 (5.95%) 20 (4.77%) 269 (5.62%)
Social Security System The local Alsace-Moselle scheme 187 (3.53%) 3 (3.57%) 17 (4.06%) 167 (3.49%)
Social Security System The basic Universal Health Coverage 151 (2.85%) 1 (1.19%) 21 (5.01%) 129 (2.69%)
Social Security System The agricultural scheme 340 (6.42%) 6 (7.14%) 20 (4.77%) 314 (6.56%)
Social Security System The self-employed scheme 338 (6.39%) 4 (4.76%) 23 (5.49%) 311 (6.49%)
Social Security System Other (Student, abroad, other) 19 (0.36%) 0 (0.00%) 2 (0.48%) 17 (0.35%)
Social Security System Does not know 5 (0.09%) 0 (0.00%) 0 (0.00%) 5 (0.1%) \(0.527\)
Occupation (n = 5,293) Farmer 160 (3.02%) 1 (1.19%) 10 (2.39%) 149 (3.11%)
Occupation Craftsman, trader 292 (5.52%) 5 (5.95%) 24 (5.73%) 263 (5.49%)
Occupation Executive and intellectual profession 745 (14.08%) 6 (7.14%) 57 (13.6%) 682 (14.24%)
Occupation Intermediate occupation 931 (17.59%) 9 (10.71%) 67 (15.99%) 855 (17.85%)
Occupation Administrative employee 713 (13.47%) 11 (13.1%) 63 (15.04%) 639 (13.34%)
Occupation Commercial employee 650 (12.28%) 14 (16.67%) 57 (13.6%) 579 (12.09%)
Occupation Skilled worker 824 (15.57%) 14 (16.67%) 65 (15.51%) 745 (15.55%)
Occupation Unskilled worker 418 (7.9%) 12 (14.29%) 45 (10.74%) 361 (7.54%)
Occupation Inactive having never worked 560 (10.58%) 12 (14.29%) 31 (7.4%) 517 (10.79%) \(0.062\)
Long-term condition (Self-declared) (n = 5,293) Yes 1018 (19.23%) 27 (32.14%) 87 (20.76%) 904 (18.87%)
Long-term condition (Self-declared) No 4262 (80.52%) 57 (67.86%) 330 (78.76%) 3875 (80.9%)
Long-term condition (Self-declared) Does not know 13 (0.25%) 0 (0.00%) 2 (0.48%) 11 (0.23%) \(0.024\)
Table 10.15: Household characteristics
ind_menages <- which(str_detect(variable_names$variable, "^MENAGE_"))
ind_menages <- c(ind_menages, which(variable_names$variable == "ensol_2011"))
print_tableau(ind = ind_menages, df = df_2, grouping_var = "same_status") |> 
  kableExtra::kable(format = "html", escape = FALSE) |> 
  kableExtra::kable_classic(full_width = F, html_font = "Cambria") |> 
  kableExtra::kable_styling(
    bootstrap_options = c("striped", "hover", "condensed", "responsive")
  ) |> 
  kableExtra::kable_styling() |>
  unclass() |> cat()
label Whole Sample Healthy (MHI-5) & Imaginary (MHI-3) Imaginary (MHI-5) & Healthy (MHI-3) Same p_value
Zoning in Urban Areas (n = 5,293) Major urban cluster (and its crown) 3680 (69.53%) 45 (53.57%) 296 (70.64%) 3339 (69.71%)
Zoning in Urban Areas Medium/small urban cluster (and its crown) 697 (13.17%) 13 (15.48%) 47 (11.22%) 637 (13.3%)
Zoning in Urban Areas Spaces outside the area of influence of cities 238 (4.5%) 7 (8.33%) 16 (3.82%) 215 (4.49%)
Zoning in Urban Areas No answer 678 (12.81%) 19 (22.62%) 60 (14.32%) 599 (12.51%) \(0.184\)
Region (n = 5,293) Région parisienne 739 (13.96%) 10 (11.9%) 62 (14.8%) 667 (13.92%)
Region Champagne-Ardenne 148 (2.8%) 2 (2.38%) 15 (3.58%) 131 (2.73%)
Region Picardie 200 (3.78%) 3 (3.57%) 19 (4.53%) 178 (3.72%)
Region Haute-Normandie 145 (2.74%) 1 (1.19%) 6 (1.43%) 138 (2.88%)
Region Centre 194 (3.67%) 3 (3.57%) 25 (5.97%) 166 (3.47%)
Region Basse-Normandie 141 (2.66%) 4 (4.76%) 10 (2.39%) 127 (2.65%)
Region Bourgogne 148 (2.8%) 2 (2.38%) 13 (3.1%) 133 (2.78%)
Region Nord-Pas-de-Calais 376 (7.1%) 5 (5.95%) 36 (8.59%) 335 (6.99%)
Region Lorraine 245 (4.63%) 3 (3.57%) 23 (5.49%) 219 (4.57%)
Region Alsace 154 (2.91%) 4 (4.76%) 13 (3.1%) 137 (2.86%)
Region Franche-Comté 115 (2.17%) 2 (2.38%) 6 (1.43%) 107 (2.23%)
Region Pays de la Loire 344 (6.5%) 7 (8.33%) 20 (4.77%) 317 (6.62%)
Region Bretagne 281 (5.31%) 9 (10.71%) 14 (3.34%) 258 (5.39%)
Region Poitou-Charentes 178 (3.36%) 3 (3.57%) 14 (3.34%) 161 (3.36%)
Region Aquitaine 278 (5.25%) 5 (5.95%) 19 (4.53%) 254 (5.3%)
Region Midi-Pyrénées 260 (4.91%) 3 (3.57%) 22 (5.25%) 235 (4.91%)
Region Limousin 52 (0.98%) 1 (1.19%) 6 (1.43%) 45 (0.94%)
Region Rhône-Alpes 596 (11.26%) 8 (9.52%) 43 (10.26%) 545 (11.38%)
Region Auvergne 122 (2.3%) 1 (1.19%) 9 (2.15%) 112 (2.34%)
Region Languedoc-Roussillon 220 (4.16%) 4 (4.76%) 16 (3.82%) 200 (4.18%)
Region Provence-Alpes-Côte d’Azur 350 (6.61%) 4 (4.76%) 27 (6.44%) 319 (6.66%)
Region Corse 7 (0.13%) 0 (0.00%) 1 (0.24%) 6 (0.13%) \(0.828\)
Income (n = 4,698) 2855.27 (+/-1893.64) 2146.73 (+/-1333.41) 2653.87 (+/-1595.28) 2886.24 (+/-1923.43) \(< 10^{-3}\)
Net Income per Cons. Unit (n = 5,293) 1609.51 (+/-1008.13) 1346.01 (+/-833.79) 1518 (+/-819.35) 1622.13 (+/-1024.85) \(0.007\)
Size Urban Area (n = 5,293) Small Municipality 1954 (36.92%) 29 (34.52%) 157 (37.47%) 1768 (36.91%)
Size Urban Area Medium Municipality 554 (10.47%) 15 (17.86%) 30 (7.16%) 509 (10.63%)
Size Urban Area Large Municipality 1587 (29.98%) 15 (17.86%) 128 (30.55%) 1444 (30.15%)
Size Urban Area Paris metropolitan area 520 (9.82%) 6 (7.14%) 44 (10.5%) 470 (9.81%)
Size Urban Area No answer 678 (12.81%) 19 (22.62%) 60 (14.32%) 599 (12.51%) \(0.242\)
Household size (n = 5,293) 2.84 (+/-1.44) 2.33 (+/-1.39) 2.82 (+/-1.43) 2.85 (+/-1.44) \(0.004\)
Sunlight (n = 5,293) 2088.7 (+/-311.91) 2057.83 (+/-291.65) 2079.69 (+/-310.89) 2090.03 (+/-312.36) \(0.533\)
Table 10.16: Household characteristics
ind_menages <- which(str_detect(variable_names$variable, "^MENAGE_"))
ind_menages <- c(ind_menages, which(variable_names$variable == "ensol_2011"))
print_tableau(
  ind = ind_menages, df = df_2 |> filter(in_sample), grouping_var = "same_status"
) |> 
  kableExtra::kable(format = "html", escape = FALSE) |> 
  kableExtra::kable_classic(full_width = F, html_font = "Cambria") |> 
  kableExtra::kable_styling(
    bootstrap_options = c("striped", "hover", "condensed", "responsive")
  ) |> 
  kableExtra::kable_styling() |>
  unclass() |> cat()
label Whole Sample Healthy (MHI-5) & Imaginary (MHI-3) Imaginary (MHI-5) & Healthy (MHI-3) Same p_value
Zoning in Urban Areas (n = 5,293) Major urban cluster (and its crown) 3680 (69.53%) 45 (53.57%) 296 (70.64%) 3339 (69.71%)
Zoning in Urban Areas Medium/small urban cluster (and its crown) 697 (13.17%) 13 (15.48%) 47 (11.22%) 637 (13.3%)
Zoning in Urban Areas Spaces outside the area of influence of cities 238 (4.5%) 7 (8.33%) 16 (3.82%) 215 (4.49%)
Zoning in Urban Areas No answer 678 (12.81%) 19 (22.62%) 60 (14.32%) 599 (12.51%) \(0.184\)
Region (n = 5,293) Région parisienne 739 (13.96%) 10 (11.9%) 62 (14.8%) 667 (13.92%)
Region Champagne-Ardenne 148 (2.8%) 2 (2.38%) 15 (3.58%) 131 (2.73%)
Region Picardie 200 (3.78%) 3 (3.57%) 19 (4.53%) 178 (3.72%)
Region Haute-Normandie 145 (2.74%) 1 (1.19%) 6 (1.43%) 138 (2.88%)
Region Centre 194 (3.67%) 3 (3.57%) 25 (5.97%) 166 (3.47%)
Region Basse-Normandie 141 (2.66%) 4 (4.76%) 10 (2.39%) 127 (2.65%)
Region Bourgogne 148 (2.8%) 2 (2.38%) 13 (3.1%) 133 (2.78%)
Region Nord-Pas-de-Calais 376 (7.1%) 5 (5.95%) 36 (8.59%) 335 (6.99%)
Region Lorraine 245 (4.63%) 3 (3.57%) 23 (5.49%) 219 (4.57%)
Region Alsace 154 (2.91%) 4 (4.76%) 13 (3.1%) 137 (2.86%)
Region Franche-Comté 115 (2.17%) 2 (2.38%) 6 (1.43%) 107 (2.23%)
Region Pays de la Loire 344 (6.5%) 7 (8.33%) 20 (4.77%) 317 (6.62%)
Region Bretagne 281 (5.31%) 9 (10.71%) 14 (3.34%) 258 (5.39%)
Region Poitou-Charentes 178 (3.36%) 3 (3.57%) 14 (3.34%) 161 (3.36%)
Region Aquitaine 278 (5.25%) 5 (5.95%) 19 (4.53%) 254 (5.3%)
Region Midi-Pyrénées 260 (4.91%) 3 (3.57%) 22 (5.25%) 235 (4.91%)
Region Limousin 52 (0.98%) 1 (1.19%) 6 (1.43%) 45 (0.94%)
Region Rhône-Alpes 596 (11.26%) 8 (9.52%) 43 (10.26%) 545 (11.38%)
Region Auvergne 122 (2.3%) 1 (1.19%) 9 (2.15%) 112 (2.34%)
Region Languedoc-Roussillon 220 (4.16%) 4 (4.76%) 16 (3.82%) 200 (4.18%)
Region Provence-Alpes-Côte d’Azur 350 (6.61%) 4 (4.76%) 27 (6.44%) 319 (6.66%)
Region Corse 7 (0.13%) 0 (0.00%) 1 (0.24%) 6 (0.13%) \(0.828\)
Income (n = 4,698) 2855.27 (+/-1893.64) 2146.73 (+/-1333.41) 2653.87 (+/-1595.28) 2886.24 (+/-1923.43) \(< 10^{-3}\)
Net Income per Cons. Unit (n = 5,293) 1609.51 (+/-1008.13) 1346.01 (+/-833.79) 1518 (+/-819.35) 1622.13 (+/-1024.85) \(0.007\)
Size Urban Area (n = 5,293) Small Municipality 1954 (36.92%) 29 (34.52%) 157 (37.47%) 1768 (36.91%)
Size Urban Area Medium Municipality 554 (10.47%) 15 (17.86%) 30 (7.16%) 509 (10.63%)
Size Urban Area Large Municipality 1587 (29.98%) 15 (17.86%) 128 (30.55%) 1444 (30.15%)
Size Urban Area Paris metropolitan area 520 (9.82%) 6 (7.14%) 44 (10.5%) 470 (9.81%)
Size Urban Area No answer 678 (12.81%) 19 (22.62%) 60 (14.32%) 599 (12.51%) \(0.242\)
Household size (n = 5,293) 2.84 (+/-1.44) 2.33 (+/-1.39) 2.82 (+/-1.43) 2.85 (+/-1.44) \(0.004\)
Sunlight (n = 5,293) 2088.7 (+/-311.91) 2057.83 (+/-291.65) 2079.69 (+/-310.89) 2090.03 (+/-312.36) \(0.533\)
Table 10.17: Healthcare expenditures
ind_soins <- which(str_detect(variable_names$variable, "^SOINS_"))
print_tableau(ind = ind_soins, df = df_2, grouping_var = "same_status") |> 
  kableExtra::kable(format = "html", escape = FALSE) |> 
  kableExtra::kable_classic(full_width = F, html_font = "Cambria") |> 
  kableExtra::kable_styling(
    bootstrap_options = c("striped", "hover", "condensed", "responsive")
  ) |> 
  kableExtra::kable_styling() |>
  unclass() |> cat()
label Whole Sample Healthy (MHI-5) & Imaginary (MHI-3) Imaginary (MHI-5) & Healthy (MHI-3) Same p_value
Long-term condition (SNIIRAM) (n = 5,293) Yes 1019 (19.25%) 29 (34.52%) 80 (19.09%) 910 (19%)
Long-term condition (SNIIRAM) No 4274 (80.75%) 55 (65.48%) 339 (80.91%) 3880 (81%) \(0.002\)
Exp. Outpatient (n = 5,293) 1469.8 (+/-2528.39) 1827.73 (+/-2149.06) 1502.58 (+/-2332.09) 1460.66 (+/-2550.88) \(0.403\)
Exp. General Practitioner (n = 5,293) 125.64 (+/-143.02) 135.8 (+/-131.21) 130.29 (+/-139.68) 125.06 (+/-143.52) \(0.623\)
Exp. Specialist (n = 5,293) 193.62 (+/-376.86) 163.6 (+/-238.88) 210.33 (+/-325.43) 192.69 (+/-382.98) \(0.5\)
Exp. Pharmacy (n = 5,293) 468.79 (+/-1473.3) 646.48 (+/-947.04) 486 (+/-1223.72) 464.17 (+/-1500.58) \(0.515\)
Exp. Physiotherapist (n = 5,293) 59.12 (+/-221.51) 100.59 (+/-401.53) 51.93 (+/-160.63) 59.02 (+/-221.67) \(0.184\)
Exp. Nurse (n = 5,293) 70.77 (+/-620.48) 220.24 (+/-931) 52.71 (+/-605.5) 69.73 (+/-614.81) \(0.073\)
Exp. Dentist (n = 5,293) 164.77 (+/-503.46) 203.66 (+/-572.82) 161.28 (+/-532.38) 164.4 (+/-499.65) \(0.77\)
Exp. Equipment (n = 5,293) 80.91 (+/-499.86) 73.11 (+/-294.65) 52.66 (+/-233.91) 83.51 (+/-519.37) \(0.475\)
Exp. Transport (n = 5,293) 57.56 (+/-610.5) 44.71 (+/-171.37) 80.67 (+/-777.2) 55.77 (+/-598.81) \(0.712\)
Exp. Optical (n = 5,293) 104.41 (+/-224.41) 79.31 (+/-197.87) 124.5 (+/-235.95) 103.1 (+/-223.75) \(0.102\)
Exp. Prostheses (n = 5,293) 39.27 (+/-248.88) 43.59 (+/-215.9) 41.75 (+/-253.36) 38.98 (+/-249.07) \(0.964\)
Exp. Emergency w/o hospitalization (n = 5,293) 14.96 (+/-51.1) 19.32 (+/-50.09) 13.53 (+/-45.06) 15 (+/-51.61) \(0.624\)
Reimbursement Outpatient (n = 5,293) 966.66 (+/-2322.13) 1292.51 (+/-1953.16) 946.79 (+/-2096.57) 962.68 (+/-2346.69) \(0.428\)
Reimbursement General Practitioner (n = 5,293) 89.44 (+/-112.53) 107.05 (+/-116.16) 93.17 (+/-114.35) 88.81 (+/-112.3) \(0.263\)
Reimbursement Specialist (n = 5,293) 133.15 (+/-301.12) 116.45 (+/-197.83) 138.84 (+/-247.11) 132.94 (+/-306.89) \(0.815\)
Reimbursement Pharmacy (n = 5,293) 361.5 (+/-1431.61) 511.08 (+/-873.34) 365.34 (+/-1178.44) 358.54 (+/-1459.43) \(0.625\)
Reimbursement Physiotherapist (n = 5,293) 42.49 (+/-191.39) 90.5 (+/-393.25) 36.42 (+/-134.54) 42.18 (+/-190.19) \(0.057\)
Reimbursement Nurse (n = 5,293) 64.22 (+/-595.92) 207.29 (+/-911.18) 47.88 (+/-601.94) 63.14 (+/-588.24) \(0.075\)
Reimbursement Dentist (n = 5,293) 58.64 (+/-135.48) 64.68 (+/-138.02) 54.93 (+/-125.88) 58.86 (+/-136.26) \(0.781\)
Reimbursement Equipment (n = 5,293) 69.36 (+/-478.52) 57.49 (+/-228.8) 39.35 (+/-207.38) 72.19 (+/-498.28) \(0.393\)
Reimbursement Transport (n = 5,293) 54.8 (+/-606.35) 31.83 (+/-102.16) 77.97 (+/-774.64) 53.17 (+/-594.7) \(0.682\)
Reimbursement Optical (n = 5,293) 2.63 (+/-6.17) 2.23 (+/-5.51) 3.14 (+/-6.87) 2.6 (+/-6.12) \(0.192\)
Reimbursement Prostheses (n = 5,293) 13.65 (+/-109.58) 13.07 (+/-36.41) 11.02 (+/-48.74) 13.89 (+/-114.19) \(0.876\)
Reimbursement Emergency w/o hospitalization (n = 5,293) 11.97 (+/-40.47) 15.78 (+/-40.38) 10.59 (+/-34.34) 12.02 (+/-40.97) \(0.537\)
Co-payment Outpatient (n = 5,293) 236.32 (+/-273.57) 255.2 (+/-283.97) 259.43 (+/-269.51) 233.97 (+/-273.68) \(0.154\)
Co-payment General Practitioner (n = 5,293) 27.22 (+/-35.42) 22.44 (+/-25.25) 28.15 (+/-32.51) 27.22 (+/-35.82) \(0.403\)
Co-payment Specialist (n = 5,293) 32.75 (+/-46.61) 25.69 (+/-33.73) 37.69 (+/-49.24) 32.44 (+/-46.54) \(0.032\)
Co-payment Pharmacy (n = 5,293) 93.7 (+/-142.51) 119.59 (+/-181.05) 105.93 (+/-149.61) 92.18 (+/-141.05) \(0.041\)
Co-payment Physiotherapist (n = 5,293) 14.73 (+/-52.04) 8.6 (+/-32.39) 14.3 (+/-42.78) 14.87 (+/-53.04) \(0.541\)
Co-payment Nurse (n = 5,293) 5.59 (+/-79.13) 10.45 (+/-83.91) 3.96 (+/-13.97) 5.65 (+/-82.34) \(0.78\)
Co-payment Dentist (n = 5,293) 21.56 (+/-52.58) 26.27 (+/-58.55) 22.34 (+/-53.64) 21.41 (+/-52.38) \(0.669\)
Co-payment Equipment (n = 5,293) 9.56 (+/-58.31) 11.83 (+/-74.41) 11.07 (+/-50.7) 9.39 (+/-58.63) \(0.798\)
Co-payment Transport (n = 5,293) 2.05 (+/-22.25) 2.83 (+/-14.46) 2.19 (+/-17.91) 2.02 (+/-22.7) \(0.938\)
Co-payment Optical (n = 5,293) 1.57 (+/-3.81) 1.4 (+/-3.59) 1.8 (+/-4.19) 1.55 (+/-3.78) \(0.401\)
Co-payment Prostheses (n = 5,293) 4.67 (+/-17.96) 6.15 (+/-22.14) 5.29 (+/-23.52) 4.59 (+/-17.31) \(0.555\)
Co-payment Emergency w/o hospitalization (n = 5,293) 2.73 (+/-11.51) 3.24 (+/-11.22) 2.69 (+/-10.85) 2.72 (+/-11.57) \(0.916\)
Extra-fees Outpatient (n = 5,293) 238.86 (+/-500.81) 246.87 (+/-496.76) 266.04 (+/-524.58) 236.34 (+/-498.78) \(0.502\)
Extra-fees General Practitioner (n = 5,293) 5.04 (+/-28.26) 2.23 (+/-11.04) 4.85 (+/-24.58) 5.11 (+/-28.77) \(0.644\)
Extra-fees Specialist (n = 5,293) 23.94 (+/-106.01) 17.72 (+/-35.24) 29.52 (+/-100.98) 23.56 (+/-107.26) \(0.47\)
Extra-fees Pharmacy (n = 5,293) 0.23 (+/-7.81) 0 (+/-0) 0.03 (+/-0.59) 0.25 (+/-8.2) \(0.831\)
Extra-fees Physiotherapist (n = 5,293) 0.81 (+/-13.9) 0 (+/-0) 0.1 (+/-1.75) 0.88 (+/-14.61) \(0.471\)
Extra-fees Nurse (n = 5,293) 0.02 (+/-0.44) 0.16 (+/-1.51) 0.02 (+/-0.4) 0.02 (+/-0.4) \(0.009\)
Extra-fees Dentist (n = 5,293) 84.57 (+/-344.5) 112.71 (+/-400.18) 84 (+/-370.67) 84.12 (+/-341.12) \(0.752\)
Extra-fees Equipment (n = 5,293) 1.99 (+/-33.16) 3.79 (+/-27.42) 2.24 (+/-20.95) 1.94 (+/-34.11) \(0.867\)
Extra-fees Transport (n = 5,293) 0.41 (+/-17.34) 9.63 (+/-88.3) 0 (+/-0) 0.29 (+/-13.98) \(< 10^{-3}\)
Extra-fees Optical (n = 5,293) 100.21 (+/-217.26) 75.67 (+/-191.4) 119.57 (+/-228.22) 98.95 (+/-216.64) \(0.102\)
Extra-fees Prostheses (n = 5,293) 20.96 (+/-189.11) 24.37 (+/-163.74) 25.43 (+/-206.3) 20.51 (+/-187.98) \(0.866\)
Extra-fees Emergency w/o hospitalization (n = 5,293) 0.02 (+/-0.51) 0.17 (+/-1.55) 0.06 (+/-0.81) 0.02 (+/-0.44) \(0.01\)
Deduct. Outpatient (n = 5,293) 27.76 (+/-28.71) 32.5 (+/-31.89) 30.23 (+/-29.45) 27.46 (+/-28.57) \(0.051\)
Deduct. General Practitioner (n = 5,293) 3.93 (+/-4.38) 4.08 (+/-4.39) 4.12 (+/-4.19) 3.91 (+/-4.39) \(0.604\)
Deduct. Specialist (n = 5,293) 3.59 (+/-4.89) 3.08 (+/-3.49) 4.19 (+/-5.39) 3.54 (+/-4.86) \(0.021\)
Deduct. Pharmacy (n = 5,293) 13.36 (+/-15.38) 15.81 (+/-17.97) 14.7 (+/-16.1) 13.2 (+/-15.25) \(0.053\)
Deduct. Physiotherapist (n = 5,293) 1.09 (+/-3.54) 1.48 (+/-4.99) 1.12 (+/-3.16) 1.08 (+/-3.55) \(0.588\)
Deduct. Nurse (n = 5,293) 0.94 (+/-4.13) 2.32 (+/-7.81) 0.85 (+/-3.82) 0.93 (+/-4.06) \(0.008\)
Deduct. Dentist (n = 5,293) 0 (+/-0.11) 0 (+/-0) 0.01 (+/-0.1) 0 (+/-0.11) \(0.601\)
Deduct. Transport (n = 5,293) 0.31 (+/-2.04) 0.43 (+/-1.76) 0.51 (+/-2.89) 0.29 (+/-1.96) \(0.094\)
Deduct. Emergency w/o hospitalization (n = 5,293) 0.24 (+/-0.92) 0.13 (+/-0.46) 0.2 (+/-0.77) 0.24 (+/-0.94) \(0.408\)
No. Medical Sessions General Pract. (n = 5,293) 4.73 (+/-5.02) 5.12 (+/-4.68) 4.91 (+/-4.99) 4.7 (+/-5.03) \(0.552\)
No. Medical Sessions Specialist (n = 5,293) 3.44 (+/-4.44) 2.93 (+/-3.06) 3.85 (+/-4.73) 3.41 (+/-4.43) \(0.087\)
Table 10.18: Healthcare expenditures
ind_soins <- which(str_detect(variable_names$variable, "^SOINS_"))
print_tableau(
  ind = ind_soins, df = df_2 |> filter(in_sample), grouping_var = "same_status"
) |> 
  kableExtra::kable(format = "html", escape = FALSE) |> 
  kableExtra::kable_classic(full_width = F, html_font = "Cambria") |> 
  kableExtra::kable_styling(
    bootstrap_options = c("striped", "hover", "condensed", "responsive")
  ) |> 
  kableExtra::kable_styling() |>
  unclass() |> cat()
label Whole Sample Healthy (MHI-5) & Imaginary (MHI-3) Imaginary (MHI-5) & Healthy (MHI-3) Same p_value
Long-term condition (SNIIRAM) (n = 5,293) Yes 1019 (19.25%) 29 (34.52%) 80 (19.09%) 910 (19%)
Long-term condition (SNIIRAM) No 4274 (80.75%) 55 (65.48%) 339 (80.91%) 3880 (81%) \(0.002\)
Exp. Outpatient (n = 5,293) 1469.8 (+/-2528.39) 1827.73 (+/-2149.06) 1502.58 (+/-2332.09) 1460.66 (+/-2550.88) \(0.403\)
Exp. General Practitioner (n = 5,293) 125.64 (+/-143.02) 135.8 (+/-131.21) 130.29 (+/-139.68) 125.06 (+/-143.52) \(0.623\)
Exp. Specialist (n = 5,293) 193.62 (+/-376.86) 163.6 (+/-238.88) 210.33 (+/-325.43) 192.69 (+/-382.98) \(0.5\)
Exp. Pharmacy (n = 5,293) 468.79 (+/-1473.3) 646.48 (+/-947.04) 486 (+/-1223.72) 464.17 (+/-1500.58) \(0.515\)
Exp. Physiotherapist (n = 5,293) 59.12 (+/-221.51) 100.59 (+/-401.53) 51.93 (+/-160.63) 59.02 (+/-221.67) \(0.184\)
Exp. Nurse (n = 5,293) 70.77 (+/-620.48) 220.24 (+/-931) 52.71 (+/-605.5) 69.73 (+/-614.81) \(0.073\)
Exp. Dentist (n = 5,293) 164.77 (+/-503.46) 203.66 (+/-572.82) 161.28 (+/-532.38) 164.4 (+/-499.65) \(0.77\)
Exp. Equipment (n = 5,293) 80.91 (+/-499.86) 73.11 (+/-294.65) 52.66 (+/-233.91) 83.51 (+/-519.37) \(0.475\)
Exp. Transport (n = 5,293) 57.56 (+/-610.5) 44.71 (+/-171.37) 80.67 (+/-777.2) 55.77 (+/-598.81) \(0.712\)
Exp. Optical (n = 5,293) 104.41 (+/-224.41) 79.31 (+/-197.87) 124.5 (+/-235.95) 103.1 (+/-223.75) \(0.102\)
Exp. Prostheses (n = 5,293) 39.27 (+/-248.88) 43.59 (+/-215.9) 41.75 (+/-253.36) 38.98 (+/-249.07) \(0.964\)
Exp. Emergency w/o hospitalization (n = 5,293) 14.96 (+/-51.1) 19.32 (+/-50.09) 13.53 (+/-45.06) 15 (+/-51.61) \(0.624\)
Reimbursement Outpatient (n = 5,293) 966.66 (+/-2322.13) 1292.51 (+/-1953.16) 946.79 (+/-2096.57) 962.68 (+/-2346.69) \(0.428\)
Reimbursement General Practitioner (n = 5,293) 89.44 (+/-112.53) 107.05 (+/-116.16) 93.17 (+/-114.35) 88.81 (+/-112.3) \(0.263\)
Reimbursement Specialist (n = 5,293) 133.15 (+/-301.12) 116.45 (+/-197.83) 138.84 (+/-247.11) 132.94 (+/-306.89) \(0.815\)
Reimbursement Pharmacy (n = 5,293) 361.5 (+/-1431.61) 511.08 (+/-873.34) 365.34 (+/-1178.44) 358.54 (+/-1459.43) \(0.625\)
Reimbursement Physiotherapist (n = 5,293) 42.49 (+/-191.39) 90.5 (+/-393.25) 36.42 (+/-134.54) 42.18 (+/-190.19) \(0.057\)
Reimbursement Nurse (n = 5,293) 64.22 (+/-595.92) 207.29 (+/-911.18) 47.88 (+/-601.94) 63.14 (+/-588.24) \(0.075\)
Reimbursement Dentist (n = 5,293) 58.64 (+/-135.48) 64.68 (+/-138.02) 54.93 (+/-125.88) 58.86 (+/-136.26) \(0.781\)
Reimbursement Equipment (n = 5,293) 69.36 (+/-478.52) 57.49 (+/-228.8) 39.35 (+/-207.38) 72.19 (+/-498.28) \(0.393\)
Reimbursement Transport (n = 5,293) 54.8 (+/-606.35) 31.83 (+/-102.16) 77.97 (+/-774.64) 53.17 (+/-594.7) \(0.682\)
Reimbursement Optical (n = 5,293) 2.63 (+/-6.17) 2.23 (+/-5.51) 3.14 (+/-6.87) 2.6 (+/-6.12) \(0.192\)
Reimbursement Prostheses (n = 5,293) 13.65 (+/-109.58) 13.07 (+/-36.41) 11.02 (+/-48.74) 13.89 (+/-114.19) \(0.876\)
Reimbursement Emergency w/o hospitalization (n = 5,293) 11.97 (+/-40.47) 15.78 (+/-40.38) 10.59 (+/-34.34) 12.02 (+/-40.97) \(0.537\)
Co-payment Outpatient (n = 5,293) 236.32 (+/-273.57) 255.2 (+/-283.97) 259.43 (+/-269.51) 233.97 (+/-273.68) \(0.154\)
Co-payment General Practitioner (n = 5,293) 27.22 (+/-35.42) 22.44 (+/-25.25) 28.15 (+/-32.51) 27.22 (+/-35.82) \(0.403\)
Co-payment Specialist (n = 5,293) 32.75 (+/-46.61) 25.69 (+/-33.73) 37.69 (+/-49.24) 32.44 (+/-46.54) \(0.032\)
Co-payment Pharmacy (n = 5,293) 93.7 (+/-142.51) 119.59 (+/-181.05) 105.93 (+/-149.61) 92.18 (+/-141.05) \(0.041\)
Co-payment Physiotherapist (n = 5,293) 14.73 (+/-52.04) 8.6 (+/-32.39) 14.3 (+/-42.78) 14.87 (+/-53.04) \(0.541\)
Co-payment Nurse (n = 5,293) 5.59 (+/-79.13) 10.45 (+/-83.91) 3.96 (+/-13.97) 5.65 (+/-82.34) \(0.78\)
Co-payment Dentist (n = 5,293) 21.56 (+/-52.58) 26.27 (+/-58.55) 22.34 (+/-53.64) 21.41 (+/-52.38) \(0.669\)
Co-payment Equipment (n = 5,293) 9.56 (+/-58.31) 11.83 (+/-74.41) 11.07 (+/-50.7) 9.39 (+/-58.63) \(0.798\)
Co-payment Transport (n = 5,293) 2.05 (+/-22.25) 2.83 (+/-14.46) 2.19 (+/-17.91) 2.02 (+/-22.7) \(0.938\)
Co-payment Optical (n = 5,293) 1.57 (+/-3.81) 1.4 (+/-3.59) 1.8 (+/-4.19) 1.55 (+/-3.78) \(0.401\)
Co-payment Prostheses (n = 5,293) 4.67 (+/-17.96) 6.15 (+/-22.14) 5.29 (+/-23.52) 4.59 (+/-17.31) \(0.555\)
Co-payment Emergency w/o hospitalization (n = 5,293) 2.73 (+/-11.51) 3.24 (+/-11.22) 2.69 (+/-10.85) 2.72 (+/-11.57) \(0.916\)
Extra-fees Outpatient (n = 5,293) 238.86 (+/-500.81) 246.87 (+/-496.76) 266.04 (+/-524.58) 236.34 (+/-498.78) \(0.502\)
Extra-fees General Practitioner (n = 5,293) 5.04 (+/-28.26) 2.23 (+/-11.04) 4.85 (+/-24.58) 5.11 (+/-28.77) \(0.644\)
Extra-fees Specialist (n = 5,293) 23.94 (+/-106.01) 17.72 (+/-35.24) 29.52 (+/-100.98) 23.56 (+/-107.26) \(0.47\)
Extra-fees Pharmacy (n = 5,293) 0.23 (+/-7.81) 0 (+/-0) 0.03 (+/-0.59) 0.25 (+/-8.2) \(0.831\)
Extra-fees Physiotherapist (n = 5,293) 0.81 (+/-13.9) 0 (+/-0) 0.1 (+/-1.75) 0.88 (+/-14.61) \(0.471\)
Extra-fees Nurse (n = 5,293) 0.02 (+/-0.44) 0.16 (+/-1.51) 0.02 (+/-0.4) 0.02 (+/-0.4) \(0.009\)
Extra-fees Dentist (n = 5,293) 84.57 (+/-344.5) 112.71 (+/-400.18) 84 (+/-370.67) 84.12 (+/-341.12) \(0.752\)
Extra-fees Equipment (n = 5,293) 1.99 (+/-33.16) 3.79 (+/-27.42) 2.24 (+/-20.95) 1.94 (+/-34.11) \(0.867\)
Extra-fees Transport (n = 5,293) 0.41 (+/-17.34) 9.63 (+/-88.3) 0 (+/-0) 0.29 (+/-13.98) \(< 10^{-3}\)
Extra-fees Optical (n = 5,293) 100.21 (+/-217.26) 75.67 (+/-191.4) 119.57 (+/-228.22) 98.95 (+/-216.64) \(0.102\)
Extra-fees Prostheses (n = 5,293) 20.96 (+/-189.11) 24.37 (+/-163.74) 25.43 (+/-206.3) 20.51 (+/-187.98) \(0.866\)
Extra-fees Emergency w/o hospitalization (n = 5,293) 0.02 (+/-0.51) 0.17 (+/-1.55) 0.06 (+/-0.81) 0.02 (+/-0.44) \(0.01\)
Deduct. Outpatient (n = 5,293) 27.76 (+/-28.71) 32.5 (+/-31.89) 30.23 (+/-29.45) 27.46 (+/-28.57) \(0.051\)
Deduct. General Practitioner (n = 5,293) 3.93 (+/-4.38) 4.08 (+/-4.39) 4.12 (+/-4.19) 3.91 (+/-4.39) \(0.604\)
Deduct. Specialist (n = 5,293) 3.59 (+/-4.89) 3.08 (+/-3.49) 4.19 (+/-5.39) 3.54 (+/-4.86) \(0.021\)
Deduct. Pharmacy (n = 5,293) 13.36 (+/-15.38) 15.81 (+/-17.97) 14.7 (+/-16.1) 13.2 (+/-15.25) \(0.053\)
Deduct. Physiotherapist (n = 5,293) 1.09 (+/-3.54) 1.48 (+/-4.99) 1.12 (+/-3.16) 1.08 (+/-3.55) \(0.588\)
Deduct. Nurse (n = 5,293) 0.94 (+/-4.13) 2.32 (+/-7.81) 0.85 (+/-3.82) 0.93 (+/-4.06) \(0.008\)
Deduct. Dentist (n = 5,293) 0 (+/-0.11) 0 (+/-0) 0.01 (+/-0.1) 0 (+/-0.11) \(0.601\)
Deduct. Transport (n = 5,293) 0.31 (+/-2.04) 0.43 (+/-1.76) 0.51 (+/-2.89) 0.29 (+/-1.96) \(0.094\)
Deduct. Emergency w/o hospitalization (n = 5,293) 0.24 (+/-0.92) 0.13 (+/-0.46) 0.2 (+/-0.77) 0.24 (+/-0.94) \(0.408\)
No. Medical Sessions General Pract. (n = 5,293) 4.73 (+/-5.02) 5.12 (+/-4.68) 4.91 (+/-4.99) 4.7 (+/-5.03) \(0.552\)
No. Medical Sessions Specialist (n = 5,293) 3.44 (+/-4.44) 2.93 (+/-3.06) 3.85 (+/-4.73) 3.41 (+/-4.43) \(0.087\)
Table 10.19: Working conditions
ind_travail <- which(str_detect(variable_names$variable, "^QST_"))
print_tableau(ind = ind_travail, df = df_2, grouping_var = "same_status") |> 
  kableExtra::kable(format = "html", escape = FALSE) |> 
  kableExtra::kable_classic(full_width = F, html_font = "Cambria") |> 
  kableExtra::kable_styling(
    bootstrap_options = c("striped", "hover", "condensed", "responsive")
  ) |> 
  kableExtra::kable_styling() |>
  unclass() |> cat()
label Whole Sample Healthy (MHI-5) & Imaginary (MHI-3) Imaginary (MHI-5) & Healthy (MHI-3) Same p_value
Have to Hurry to Do Job (n = 5,293) Always 391 (7.39%) 3 (3.57%) 50 (11.93%) 338 (7.06%)
Have to Hurry to Do Job Often 895 (16.91%) 9 (10.71%) 82 (19.57%) 804 (16.78%)
Have to Hurry to Do Job Sometimes 1016 (19.2%) 5 (5.95%) 76 (18.14%) 935 (19.52%)
Have to Hurry to Do Job Never 247 (4.67%) 0 (0.00%) 11 (2.63%) 236 (4.93%)
Have to Hurry to Do Job No answer 2744 (51.84%) 67 (79.76%) 200 (47.73%) 2477 (51.71%) \(< 10^{-3}\)
Very Little Freedom to Do Job (n = 5,293) Always 126 (2.38%) 1 (1.19%) 12 (2.86%) 113 (2.36%)
Very Little Freedom to Do Job Often 299 (5.65%) 5 (5.95%) 42 (10.02%) 252 (5.26%)
Very Little Freedom to Do Job Sometimes 1084 (20.48%) 7 (8.33%) 82 (19.57%) 995 (20.77%)
Very Little Freedom to Do Job Never 1028 (19.42%) 4 (4.76%) 82 (19.57%) 942 (19.67%)
Very Little Freedom to Do Job No answer 2756 (52.07%) 67 (79.76%) 201 (47.97%) 2488 (51.94%) \(< 10^{-3}\)
Job Allows to Learn New Things (n = 5,293) Always 401 (7.58%) 2 (2.38%) 36 (8.59%) 363 (7.58%)
Job Allows to Learn New Things Often 960 (18.14%) 5 (5.95%) 88 (21%) 867 (18.1%)
Job Allows to Learn New Things Sometimes 1039 (19.63%) 6 (7.14%) 81 (19.33%) 952 (19.87%)
Job Allows to Learn New Things Never 151 (2.85%) 4 (4.76%) 17 (4.06%) 130 (2.71%)
Job Allows to Learn New Things No answer 2742 (51.8%) 67 (79.76%) 197 (47.02%) 2478 (51.73%) \(< 10^{-3}\)
Colleagues Help Carry out Tasks (n = 5,293) Always 291 (5.5%) 2 (2.38%) 20 (4.77%) 269 (5.62%)
Colleagues Help Carry out Tasks Often 785 (14.83%) 1 (1.19%) 62 (14.8%) 722 (15.07%)
Colleagues Help Carry out Tasks Sometimes 978 (18.48%) 8 (9.52%) 96 (22.91%) 874 (18.25%)
Colleagues Help Carry out Tasks Never 241 (4.55%) 4 (4.76%) 28 (6.68%) 209 (4.36%)
Colleagues Help Carry out Tasks Not concered 247 (4.67%) 2 (2.38%) 15 (3.58%) 230 (4.8%)
Colleagues Help Carry out Tasks No answer 2751 (51.97%) 67 (79.76%) 198 (47.26%) 2486 (51.9%) \(< 10^{-3}\)
Job Requires not to Sleep Betw. Midnight and 5 a.m. (n = 5,293) Always 61 (1.15%) 0 (0.00%) 6 (1.43%) 55 (1.15%)
Job Requires not to Sleep Betw. Midnight and 5 a.m. Often 91 (1.72%) 0 (0.00%) 7 (1.67%) 84 (1.75%)
Job Requires not to Sleep Betw. Midnight and 5 a.m. Sometimes 254 (4.8%) 5 (5.95%) 19 (4.53%) 230 (4.8%)
Job Requires not to Sleep Betw. Midnight and 5 a.m. Never 2136 (40.36%) 13 (15.48%) 186 (44.39%) 1937 (40.44%)
Job Requires not to Sleep Betw. Midnight and 5 a.m. No answer 2751 (51.97%) 66 (78.57%) 201 (47.97%) 2484 (51.86%) \(< 10^{-3}\)
Repetitive Work under Time Constraints / Line Job (n = 5,293) Always 174 (3.29%) 4 (4.76%) 22 (5.25%) 148 (3.09%)
Repetitive Work under Time Constraints / Line Job Often 227 (4.29%) 1 (1.19%) 22 (5.25%) 204 (4.26%)
Repetitive Work under Time Constraints / Line Job Sometimes 330 (6.23%) 5 (5.95%) 26 (6.21%) 299 (6.24%)
Repetitive Work under Time Constraints / Line Job Never 1809 (34.18%) 9 (10.71%) 147 (35.08%) 1653 (34.51%)
Repetitive Work under Time Constraints / Line Job No answer 2753 (52.01%) 65 (77.38%) 202 (48.21%) 2486 (51.9%) \(< 10^{-3}\)
Exposed to Carrying Heavy Loads (n = 5,293) Always 187 (3.53%) 3 (3.57%) 19 (4.53%) 165 (3.44%)
Exposed to Carrying Heavy Loads Often 392 (7.41%) 4 (4.76%) 37 (8.83%) 351 (7.33%)
Exposed to Carrying Heavy Loads Sometimes 725 (13.7%) 2 (2.38%) 58 (13.84%) 665 (13.88%)
Exposed to Carrying Heavy Loads Never 1237 (23.37%) 9 (10.71%) 104 (24.82%) 1124 (23.47%)
Exposed to Carrying Heavy Loads No answer 2752 (51.99%) 66 (78.57%) 201 (47.97%) 2485 (51.88%) \(< 10^{-3}\)
Exposed to Painful Postures (n = 5,293) Always 409 (7.73%) 5 (5.95%) 38 (9.07%) 366 (7.64%)
Exposed to Painful Postures Often 523 (9.88%) 5 (5.95%) 43 (10.26%) 475 (9.92%)
Exposed to Painful Postures Sometimes 533 (10.07%) 3 (3.57%) 39 (9.31%) 491 (10.25%)
Exposed to Painful Postures Never 1078 (20.37%) 6 (7.14%) 98 (23.39%) 974 (20.33%)
Exposed to Painful Postures No answer 2750 (51.96%) 65 (77.38%) 201 (47.97%) 2484 (51.86%) \(< 10^{-3}\)
Exposed to Harmful/Toxic Products/Substances (n = 5,293) Always 211 (3.99%) 2 (2.38%) 29 (6.92%) 180 (3.76%)
Exposed to Harmful/Toxic Products/Substances Often 335 (6.33%) 4 (4.76%) 21 (5.01%) 310 (6.47%)
Exposed to Harmful/Toxic Products/Substances Sometimes 582 (11%) 5 (5.95%) 43 (10.26%) 534 (11.15%)
Exposed to Harmful/Toxic Products/Substances Never 1415 (26.73%) 8 (9.52%) 126 (30.07%) 1281 (26.74%)
Exposed to Harmful/Toxic Products/Substances No answer 2750 (51.96%) 65 (77.38%) 200 (47.73%) 2485 (51.88%) \(< 10^{-3}\)
Table 10.20: Working conditions
ind_travail <- which(str_detect(variable_names$variable, "^QST_"))
print_tableau(
  ind = ind_travail, df = df_2 |> filter(in_sample), grouping_var = "same_status"
) |> 
  kableExtra::kable(format = "html", escape = FALSE) |> 
  kableExtra::kable_classic(full_width = F, html_font = "Cambria") |> 
  kableExtra::kable_styling(
    bootstrap_options = c("striped", "hover", "condensed", "responsive")
  ) |> 
  kableExtra::kable_styling() |>
  unclass() |> cat()
label Whole Sample Healthy (MHI-5) & Imaginary (MHI-3) Imaginary (MHI-5) & Healthy (MHI-3) Same p_value
Have to Hurry to Do Job (n = 5,293) Always 391 (7.39%) 3 (3.57%) 50 (11.93%) 338 (7.06%)
Have to Hurry to Do Job Often 895 (16.91%) 9 (10.71%) 82 (19.57%) 804 (16.78%)
Have to Hurry to Do Job Sometimes 1016 (19.2%) 5 (5.95%) 76 (18.14%) 935 (19.52%)
Have to Hurry to Do Job Never 247 (4.67%) 0 (0.00%) 11 (2.63%) 236 (4.93%)
Have to Hurry to Do Job No answer 2744 (51.84%) 67 (79.76%) 200 (47.73%) 2477 (51.71%) \(< 10^{-3}\)
Very Little Freedom to Do Job (n = 5,293) Always 126 (2.38%) 1 (1.19%) 12 (2.86%) 113 (2.36%)
Very Little Freedom to Do Job Often 299 (5.65%) 5 (5.95%) 42 (10.02%) 252 (5.26%)
Very Little Freedom to Do Job Sometimes 1084 (20.48%) 7 (8.33%) 82 (19.57%) 995 (20.77%)
Very Little Freedom to Do Job Never 1028 (19.42%) 4 (4.76%) 82 (19.57%) 942 (19.67%)
Very Little Freedom to Do Job No answer 2756 (52.07%) 67 (79.76%) 201 (47.97%) 2488 (51.94%) \(< 10^{-3}\)
Job Allows to Learn New Things (n = 5,293) Always 401 (7.58%) 2 (2.38%) 36 (8.59%) 363 (7.58%)
Job Allows to Learn New Things Often 960 (18.14%) 5 (5.95%) 88 (21%) 867 (18.1%)
Job Allows to Learn New Things Sometimes 1039 (19.63%) 6 (7.14%) 81 (19.33%) 952 (19.87%)
Job Allows to Learn New Things Never 151 (2.85%) 4 (4.76%) 17 (4.06%) 130 (2.71%)
Job Allows to Learn New Things No answer 2742 (51.8%) 67 (79.76%) 197 (47.02%) 2478 (51.73%) \(< 10^{-3}\)
Colleagues Help Carry out Tasks (n = 5,293) Always 291 (5.5%) 2 (2.38%) 20 (4.77%) 269 (5.62%)
Colleagues Help Carry out Tasks Often 785 (14.83%) 1 (1.19%) 62 (14.8%) 722 (15.07%)
Colleagues Help Carry out Tasks Sometimes 978 (18.48%) 8 (9.52%) 96 (22.91%) 874 (18.25%)
Colleagues Help Carry out Tasks Never 241 (4.55%) 4 (4.76%) 28 (6.68%) 209 (4.36%)
Colleagues Help Carry out Tasks Not concered 247 (4.67%) 2 (2.38%) 15 (3.58%) 230 (4.8%)
Colleagues Help Carry out Tasks No answer 2751 (51.97%) 67 (79.76%) 198 (47.26%) 2486 (51.9%) \(< 10^{-3}\)
Job Requires not to Sleep Betw. Midnight and 5 a.m. (n = 5,293) Always 61 (1.15%) 0 (0.00%) 6 (1.43%) 55 (1.15%)
Job Requires not to Sleep Betw. Midnight and 5 a.m. Often 91 (1.72%) 0 (0.00%) 7 (1.67%) 84 (1.75%)
Job Requires not to Sleep Betw. Midnight and 5 a.m. Sometimes 254 (4.8%) 5 (5.95%) 19 (4.53%) 230 (4.8%)
Job Requires not to Sleep Betw. Midnight and 5 a.m. Never 2136 (40.36%) 13 (15.48%) 186 (44.39%) 1937 (40.44%)
Job Requires not to Sleep Betw. Midnight and 5 a.m. No answer 2751 (51.97%) 66 (78.57%) 201 (47.97%) 2484 (51.86%) \(< 10^{-3}\)
Repetitive Work under Time Constraints / Line Job (n = 5,293) Always 174 (3.29%) 4 (4.76%) 22 (5.25%) 148 (3.09%)
Repetitive Work under Time Constraints / Line Job Often 227 (4.29%) 1 (1.19%) 22 (5.25%) 204 (4.26%)
Repetitive Work under Time Constraints / Line Job Sometimes 330 (6.23%) 5 (5.95%) 26 (6.21%) 299 (6.24%)
Repetitive Work under Time Constraints / Line Job Never 1809 (34.18%) 9 (10.71%) 147 (35.08%) 1653 (34.51%)
Repetitive Work under Time Constraints / Line Job No answer 2753 (52.01%) 65 (77.38%) 202 (48.21%) 2486 (51.9%) \(< 10^{-3}\)
Exposed to Carrying Heavy Loads (n = 5,293) Always 187 (3.53%) 3 (3.57%) 19 (4.53%) 165 (3.44%)
Exposed to Carrying Heavy Loads Often 392 (7.41%) 4 (4.76%) 37 (8.83%) 351 (7.33%)
Exposed to Carrying Heavy Loads Sometimes 725 (13.7%) 2 (2.38%) 58 (13.84%) 665 (13.88%)
Exposed to Carrying Heavy Loads Never 1237 (23.37%) 9 (10.71%) 104 (24.82%) 1124 (23.47%)
Exposed to Carrying Heavy Loads No answer 2752 (51.99%) 66 (78.57%) 201 (47.97%) 2485 (51.88%) \(< 10^{-3}\)
Exposed to Painful Postures (n = 5,293) Always 409 (7.73%) 5 (5.95%) 38 (9.07%) 366 (7.64%)
Exposed to Painful Postures Often 523 (9.88%) 5 (5.95%) 43 (10.26%) 475 (9.92%)
Exposed to Painful Postures Sometimes 533 (10.07%) 3 (3.57%) 39 (9.31%) 491 (10.25%)
Exposed to Painful Postures Never 1078 (20.37%) 6 (7.14%) 98 (23.39%) 974 (20.33%)
Exposed to Painful Postures No answer 2750 (51.96%) 65 (77.38%) 201 (47.97%) 2484 (51.86%) \(< 10^{-3}\)
Exposed to Harmful/Toxic Products/Substances (n = 5,293) Always 211 (3.99%) 2 (2.38%) 29 (6.92%) 180 (3.76%)
Exposed to Harmful/Toxic Products/Substances Often 335 (6.33%) 4 (4.76%) 21 (5.01%) 310 (6.47%)
Exposed to Harmful/Toxic Products/Substances Sometimes 582 (11%) 5 (5.95%) 43 (10.26%) 534 (11.15%)
Exposed to Harmful/Toxic Products/Substances Never 1415 (26.73%) 8 (9.52%) 126 (30.07%) 1281 (26.74%)
Exposed to Harmful/Toxic Products/Substances No answer 2750 (51.96%) 65 (77.38%) 200 (47.73%) 2485 (51.88%) \(< 10^{-3}\)
Table 10.21: Economic and social situation
ind_autre <- which(str_detect(variable_names$variable, "^QES_"))
print_tableau(ind = ind_autre, df = df_2, grouping_var = "same_status") |> 
  kableExtra::kable(format = "html", escape = FALSE) |> 
  kableExtra::kable_classic(full_width = F, html_font = "Cambria") |> 
  kableExtra::kable_styling(
    bootstrap_options = c("striped", "hover", "condensed", "responsive")
  ) |> 
  kableExtra::kable_styling() |>
  unclass() |> cat()
label Whole Sample Healthy (MHI-5) & Imaginary (MHI-3) Imaginary (MHI-5) & Healthy (MHI-3) Same p_value
Participation in Group Activities (n = 5,293) Yes 1848 (34.91%) 25 (29.76%) 124 (29.59%) 1699 (35.47%)
Participation in Group Activities No 3337 (63.05%) 58 (69.05%) 285 (68.02%) 2994 (62.51%)
Participation in Group Activities No answer 108 (2.04%) 1 (1.19%) 10 (2.39%) 97 (2.03%) \(0.118\)
Frequency Meeting with Friends/Neighbors (n = 5,293) Every day or almost every day 1144 (21.61%) 16 (19.05%) 80 (19.09%) 1048 (21.88%)
Frequency Meeting with Friends/Neighbors At least once a week 2150 (40.62%) 25 (29.76%) 166 (39.62%) 1959 (40.9%)
Frequency Meeting with Friends/Neighbors At least once a month 1098 (20.74%) 19 (22.62%) 91 (21.72%) 988 (20.63%)
Frequency Meeting with Friends/Neighbors Less than once a month 497 (9.39%) 9 (10.71%) 41 (9.79%) 447 (9.33%)
Frequency Meeting with Friends/Neighbors Never 270 (5.1%) 10 (11.9%) 29 (6.92%) 231 (4.82%)
Frequency Meeting with Friends/Neighbors No answer 134 (2.53%) 5 (5.95%) 12 (2.86%) 117 (2.44%) \(0.028\)
Frequency Meeting with People in Organizations (n = 5,293) Every day or almost every day 161 (3.04%) 5 (5.95%) 11 (2.63%) 145 (3.03%)
Frequency Meeting with People in Organizations At least once a week 912 (17.23%) 16 (19.05%) 51 (12.17%) 845 (17.64%)
Frequency Meeting with People in Organizations At least once a month 604 (11.41%) 9 (10.71%) 50 (11.93%) 545 (11.38%)
Frequency Meeting with People in Organizations Less than once a month 657 (12.41%) 11 (13.1%) 48 (11.46%) 598 (12.48%)
Frequency Meeting with People in Organizations Never 2717 (51.33%) 38 (45.24%) 238 (56.8%) 2441 (50.96%)
Frequency Meeting with People in Organizations No answer 242 (4.57%) 5 (5.95%) 21 (5.01%) 216 (4.51%) \(0.188\)
Frequency Meeting with Colleagues Outside Work (n = 5,293) Every day or almost every day 275 (5.2%) 1 (1.19%) 19 (4.53%) 255 (5.32%)
Frequency Meeting with Colleagues Outside Work At least once a week 446 (8.43%) 8 (9.52%) 36 (8.59%) 402 (8.39%)
Frequency Meeting with Colleagues Outside Work At least once a month 670 (12.66%) 6 (7.14%) 54 (12.89%) 610 (12.73%)
Frequency Meeting with Colleagues Outside Work Less than once a month 1032 (19.5%) 15 (17.86%) 83 (19.81%) 934 (19.5%)
Frequency Meeting with Colleagues Outside Work Never 2374 (44.85%) 40 (47.62%) 199 (47.49%) 2135 (44.57%)
Frequency Meeting with Colleagues Outside Work No answer 496 (9.37%) 14 (16.67%) 28 (6.68%) 454 (9.48%) \(0.157\)
Frequency Meeting with Family Living Outside Household (n = 5,293) Every day or almost every day 1022 (19.31%) 16 (19.05%) 92 (21.96%) 914 (19.08%)
Frequency Meeting with Family Living Outside Household At least once a week 1969 (37.2%) 26 (30.95%) 145 (34.61%) 1798 (37.54%)
Frequency Meeting with Family Living Outside Household At least once a month 1157 (21.86%) 19 (22.62%) 90 (21.48%) 1048 (21.88%)
Frequency Meeting with Family Living Outside Household Less than once a month 783 (14.79%) 13 (15.48%) 53 (12.65%) 717 (14.97%)
Frequency Meeting with Family Living Outside Household Never 208 (3.93%) 7 (8.33%) 22 (5.25%) 179 (3.74%)
Frequency Meeting with Family Living Outside Household No answer 154 (2.91%) 3 (3.57%) 17 (4.06%) 134 (2.8%) \(0.192\)
Mother’s Level of Education (n = 5,293) Never Been to School 355 (6.71%) 7 (8.33%) 22 (5.25%) 326 (6.81%)
Mother’s Level of Education Nursery School, Primary school, Certificate of studies 1996 (37.71%) 35 (41.67%) 169 (40.33%) 1792 (37.41%)
Mother’s Level of Education 1st cycle (~Middle School) 968 (18.29%) 8 (9.52%) 75 (17.9%) 885 (18.48%)
Mother’s Level of Education 2nd cycle (~High School 458 (8.65%) 12 (14.29%) 31 (7.4%) 415 (8.66%)
Mother’s Level of Education Higher Education 478 (9.03%) 6 (7.14%) 37 (8.83%) 435 (9.08%)
Mother’s Level of Education Other 82 (1.55%) 0 (0.00%) 6 (1.43%) 76 (1.59%)
Mother’s Level of Education Does not know 857 (16.19%) 13 (15.48%) 72 (17.18%) 772 (16.12%)
Mother’s Level of Education No answer 99 (1.87%) 3 (3.57%) 7 (1.67%) 89 (1.86%) \(0.458\)
Father’s Level of Education (n = 5,293) Never Been to School 292 (5.52%) 8 (9.52%) 18 (4.3%) 266 (5.55%)
Father’s Level of Education Nursery School, Primary school, Certificate of studies 1830 (34.57%) 28 (33.33%) 151 (36.04%) 1651 (34.47%)
Father’s Level of Education 1st cycle (~Middle School) 1037 (19.59%) 17 (20.24%) 81 (19.33%) 939 (19.6%)
Father’s Level of Education 2nd cycle (~High School 401 (7.58%) 5 (5.95%) 29 (6.92%) 367 (7.66%)
Father’s Level of Education Higher Education 565 (10.67%) 8 (9.52%) 40 (9.55%) 517 (10.79%)
Father’s Level of Education Other 123 (2.32%) 1 (1.19%) 11 (2.63%) 111 (2.32%)
Father’s Level of Education Does not know 948 (17.91%) 16 (19.05%) 80 (19.09%) 852 (17.79%)
Father’s Level of Education No answer 97 (1.83%) 1 (1.19%) 9 (2.15%) 87 (1.82%) \(0.947\)
Table 10.22: Economic and social situation
ind_autre <- which(str_detect(variable_names$variable, "^QES_"))
print_tableau(
  ind = ind_autre, df = df_2 |> filter(in_sample), grouping_var = "same_status"
) |> 
  kableExtra::kable(format = "html", escape = FALSE) |> 
  kableExtra::kable_classic(full_width = F, html_font = "Cambria") |> 
  kableExtra::kable_styling(
    bootstrap_options = c("striped", "hover", "condensed", "responsive")
  ) |> 
  kableExtra::kable_styling() |>
  unclass() |> cat()
label Whole Sample Healthy (MHI-5) & Imaginary (MHI-3) Imaginary (MHI-5) & Healthy (MHI-3) Same p_value
Participation in Group Activities (n = 5,293) Yes 1848 (34.91%) 25 (29.76%) 124 (29.59%) 1699 (35.47%)
Participation in Group Activities No 3337 (63.05%) 58 (69.05%) 285 (68.02%) 2994 (62.51%)
Participation in Group Activities No answer 108 (2.04%) 1 (1.19%) 10 (2.39%) 97 (2.03%) \(0.118\)
Frequency Meeting with Friends/Neighbors (n = 5,293) Every day or almost every day 1144 (21.61%) 16 (19.05%) 80 (19.09%) 1048 (21.88%)
Frequency Meeting with Friends/Neighbors At least once a week 2150 (40.62%) 25 (29.76%) 166 (39.62%) 1959 (40.9%)
Frequency Meeting with Friends/Neighbors At least once a month 1098 (20.74%) 19 (22.62%) 91 (21.72%) 988 (20.63%)
Frequency Meeting with Friends/Neighbors Less than once a month 497 (9.39%) 9 (10.71%) 41 (9.79%) 447 (9.33%)
Frequency Meeting with Friends/Neighbors Never 270 (5.1%) 10 (11.9%) 29 (6.92%) 231 (4.82%)
Frequency Meeting with Friends/Neighbors No answer 134 (2.53%) 5 (5.95%) 12 (2.86%) 117 (2.44%) \(0.028\)
Frequency Meeting with People in Organizations (n = 5,293) Every day or almost every day 161 (3.04%) 5 (5.95%) 11 (2.63%) 145 (3.03%)
Frequency Meeting with People in Organizations At least once a week 912 (17.23%) 16 (19.05%) 51 (12.17%) 845 (17.64%)
Frequency Meeting with People in Organizations At least once a month 604 (11.41%) 9 (10.71%) 50 (11.93%) 545 (11.38%)
Frequency Meeting with People in Organizations Less than once a month 657 (12.41%) 11 (13.1%) 48 (11.46%) 598 (12.48%)
Frequency Meeting with People in Organizations Never 2717 (51.33%) 38 (45.24%) 238 (56.8%) 2441 (50.96%)
Frequency Meeting with People in Organizations No answer 242 (4.57%) 5 (5.95%) 21 (5.01%) 216 (4.51%) \(0.188\)
Frequency Meeting with Colleagues Outside Work (n = 5,293) Every day or almost every day 275 (5.2%) 1 (1.19%) 19 (4.53%) 255 (5.32%)
Frequency Meeting with Colleagues Outside Work At least once a week 446 (8.43%) 8 (9.52%) 36 (8.59%) 402 (8.39%)
Frequency Meeting with Colleagues Outside Work At least once a month 670 (12.66%) 6 (7.14%) 54 (12.89%) 610 (12.73%)
Frequency Meeting with Colleagues Outside Work Less than once a month 1032 (19.5%) 15 (17.86%) 83 (19.81%) 934 (19.5%)
Frequency Meeting with Colleagues Outside Work Never 2374 (44.85%) 40 (47.62%) 199 (47.49%) 2135 (44.57%)
Frequency Meeting with Colleagues Outside Work No answer 496 (9.37%) 14 (16.67%) 28 (6.68%) 454 (9.48%) \(0.157\)
Frequency Meeting with Family Living Outside Household (n = 5,293) Every day or almost every day 1022 (19.31%) 16 (19.05%) 92 (21.96%) 914 (19.08%)
Frequency Meeting with Family Living Outside Household At least once a week 1969 (37.2%) 26 (30.95%) 145 (34.61%) 1798 (37.54%)
Frequency Meeting with Family Living Outside Household At least once a month 1157 (21.86%) 19 (22.62%) 90 (21.48%) 1048 (21.88%)
Frequency Meeting with Family Living Outside Household Less than once a month 783 (14.79%) 13 (15.48%) 53 (12.65%) 717 (14.97%)
Frequency Meeting with Family Living Outside Household Never 208 (3.93%) 7 (8.33%) 22 (5.25%) 179 (3.74%)
Frequency Meeting with Family Living Outside Household No answer 154 (2.91%) 3 (3.57%) 17 (4.06%) 134 (2.8%) \(0.192\)
Mother’s Level of Education (n = 5,293) Never Been to School 355 (6.71%) 7 (8.33%) 22 (5.25%) 326 (6.81%)
Mother’s Level of Education Nursery School, Primary school, Certificate of studies 1996 (37.71%) 35 (41.67%) 169 (40.33%) 1792 (37.41%)
Mother’s Level of Education 1st cycle (~Middle School) 968 (18.29%) 8 (9.52%) 75 (17.9%) 885 (18.48%)
Mother’s Level of Education 2nd cycle (~High School 458 (8.65%) 12 (14.29%) 31 (7.4%) 415 (8.66%)
Mother’s Level of Education Higher Education 478 (9.03%) 6 (7.14%) 37 (8.83%) 435 (9.08%)
Mother’s Level of Education Other 82 (1.55%) 0 (0.00%) 6 (1.43%) 76 (1.59%)
Mother’s Level of Education Does not know 857 (16.19%) 13 (15.48%) 72 (17.18%) 772 (16.12%)
Mother’s Level of Education No answer 99 (1.87%) 3 (3.57%) 7 (1.67%) 89 (1.86%) \(0.458\)
Father’s Level of Education (n = 5,293) Never Been to School 292 (5.52%) 8 (9.52%) 18 (4.3%) 266 (5.55%)
Father’s Level of Education Nursery School, Primary school, Certificate of studies 1830 (34.57%) 28 (33.33%) 151 (36.04%) 1651 (34.47%)
Father’s Level of Education 1st cycle (~Middle School) 1037 (19.59%) 17 (20.24%) 81 (19.33%) 939 (19.6%)
Father’s Level of Education 2nd cycle (~High School 401 (7.58%) 5 (5.95%) 29 (6.92%) 367 (7.66%)
Father’s Level of Education Higher Education 565 (10.67%) 8 (9.52%) 40 (9.55%) 517 (10.79%)
Father’s Level of Education Other 123 (2.32%) 1 (1.19%) 11 (2.63%) 111 (2.32%)
Father’s Level of Education Does not know 948 (17.91%) 16 (19.05%) 80 (19.09%) 852 (17.79%)
Father’s Level of Education No answer 97 (1.83%) 1 (1.19%) 9 (2.15%) 87 (1.82%) \(0.947\)
Table 10.23: Opinion
ind_opinion_1 <- which(str_detect(variable_names$variable, "^OPINION1_"))
print_tableau(ind = ind_opinion_1, df = df_2, grouping_var = "same_status") |> 
  kableExtra::kable(format = "html", escape = FALSE) |> 
  kableExtra::kable_classic(full_width = F, html_font = "Cambria") |> 
  kableExtra::kable_styling(
    bootstrap_options = c("striped", "hover", "condensed", "responsive")
  ) |> 
  kableExtra::kable_styling() |>
  unclass() |> cat()
label Whole Sample Healthy (MHI-5) & Imaginary (MHI-3) Imaginary (MHI-5) & Healthy (MHI-3) Same p_value
Waiver General Practitioner (n = 5,293) Yes 188 (3.55%) 4 (4.76%) 27 (6.44%) 157 (3.28%)
Waiver General Practitioner No 4024 (76.02%) 64 (76.19%) 324 (77.33%) 3636 (75.91%)
Waiver General Practitioner No answer 1081 (20.42%) 16 (19.05%) 68 (16.23%) 997 (20.81%) \(0.004\)
Waiver Dental Care (n = 5,293) Yes 695 (13.13%) 15 (17.86%) 71 (16.95%) 609 (12.71%)
Waiver Dental Care No 3517 (66.45%) 53 (63.1%) 280 (66.83%) 3184 (66.47%)
Waiver Dental Care No answer 1081 (20.42%) 16 (19.05%) 68 (16.23%) 997 (20.81%) \(0.028\)
Waiver Other Health Care (n = 5,293) Yes 169 (3.19%) 3 (3.57%) 22 (5.25%) 144 (3.01%)
Waiver Other Health Care No 4043 (76.38%) 65 (77.38%) 329 (78.52%) 3649 (76.18%)
Waiver Other Health Care No answer 1081 (20.42%) 16 (19.05%) 68 (16.23%) 997 (20.81%) \(0.034\)
Waiver Health Care Too Far (n = 5,293) Yes 100 (1.89%) 4 (4.76%) 14 (3.34%) 82 (1.71%)
Waiver Health Care Too Far No 4112 (77.69%) 64 (76.19%) 337 (80.43%) 3711 (77.47%)
Waiver Health Care Too Far No answer 1081 (20.42%) 16 (19.05%) 68 (16.23%) 997 (20.81%) \(0.009\)
Waiver Appointment Delay Too Long (n = 5,293) Yes 632 (11.94%) 10 (11.9%) 64 (15.27%) 558 (11.65%)
Waiver Appointment Delay Too Long No 3580 (67.64%) 58 (69.05%) 287 (68.5%) 3235 (67.54%)
Waiver Appointment Delay Too Long No answer 1081 (20.42%) 16 (19.05%) 68 (16.23%) 997 (20.81%) \(0.079\)
Table 10.24: Opinion
ind_opinion_1 <- which(str_detect(variable_names$variable, "^OPINION1_"))
print_tableau(
  ind = ind_opinion_1, df = df_2 |> filter(in_sample), grouping_var = "same_status"
) |> 
  kableExtra::kable(format = "html", escape = FALSE) |> 
  kableExtra::kable_classic(full_width = F, html_font = "Cambria") |> 
  kableExtra::kable_styling(
    bootstrap_options = c("striped", "hover", "condensed", "responsive")
  ) |> 
  kableExtra::kable_styling() |>
  unclass() |> cat()
label Whole Sample Healthy (MHI-5) & Imaginary (MHI-3) Imaginary (MHI-5) & Healthy (MHI-3) Same p_value
Waiver General Practitioner (n = 5,293) Yes 188 (3.55%) 4 (4.76%) 27 (6.44%) 157 (3.28%)
Waiver General Practitioner No 4024 (76.02%) 64 (76.19%) 324 (77.33%) 3636 (75.91%)
Waiver General Practitioner No answer 1081 (20.42%) 16 (19.05%) 68 (16.23%) 997 (20.81%) \(0.004\)
Waiver Dental Care (n = 5,293) Yes 695 (13.13%) 15 (17.86%) 71 (16.95%) 609 (12.71%)
Waiver Dental Care No 3517 (66.45%) 53 (63.1%) 280 (66.83%) 3184 (66.47%)
Waiver Dental Care No answer 1081 (20.42%) 16 (19.05%) 68 (16.23%) 997 (20.81%) \(0.028\)
Waiver Other Health Care (n = 5,293) Yes 169 (3.19%) 3 (3.57%) 22 (5.25%) 144 (3.01%)
Waiver Other Health Care No 4043 (76.38%) 65 (77.38%) 329 (78.52%) 3649 (76.18%)
Waiver Other Health Care No answer 1081 (20.42%) 16 (19.05%) 68 (16.23%) 997 (20.81%) \(0.034\)
Waiver Health Care Too Far (n = 5,293) Yes 100 (1.89%) 4 (4.76%) 14 (3.34%) 82 (1.71%)
Waiver Health Care Too Far No 4112 (77.69%) 64 (76.19%) 337 (80.43%) 3711 (77.47%)
Waiver Health Care Too Far No answer 1081 (20.42%) 16 (19.05%) 68 (16.23%) 997 (20.81%) \(0.009\)
Waiver Appointment Delay Too Long (n = 5,293) Yes 632 (11.94%) 10 (11.9%) 64 (15.27%) 558 (11.65%)
Waiver Appointment Delay Too Long No 3580 (67.64%) 58 (69.05%) 287 (68.5%) 3235 (67.54%)
Waiver Appointment Delay Too Long No answer 1081 (20.42%) 16 (19.05%) 68 (16.23%) 997 (20.81%) \(0.079\)