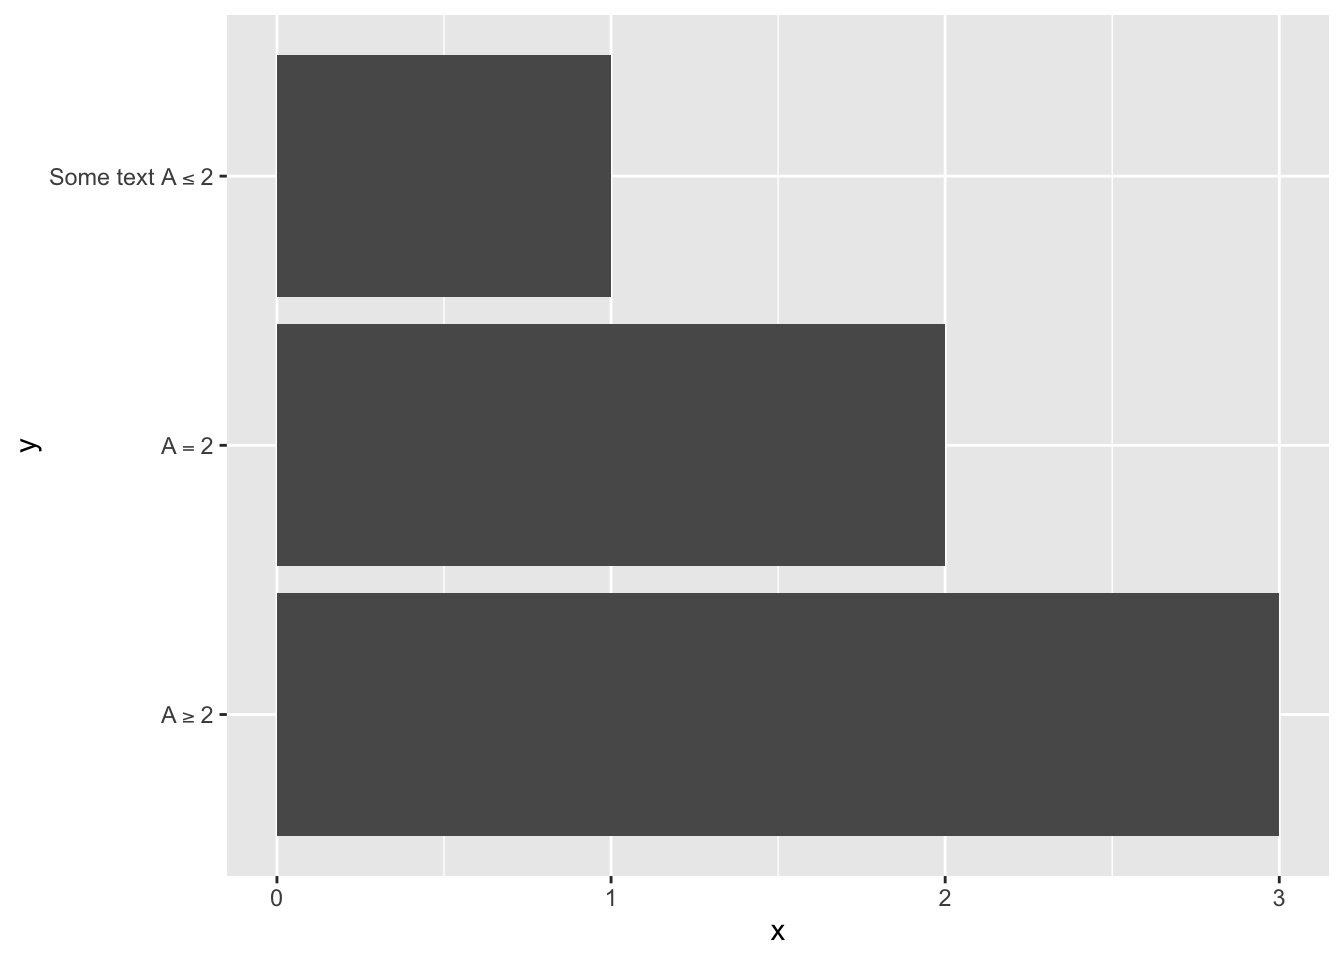
I want to interpret LaTeX formulas contained in a column of a dataset used to plot observations. The easiest way I found to do so is to use the TeX() function from {latex2exp} passed on to the labels argument of the scale_y_discrete() from {ggplot2}.
library(tibble)library(ggplot2)df <-tibble(x =c(1,2,3), y =c("Some text $A \\leq 2$", "$A = 2$", "$A \\geq 2$"))ggplot(data = df, mapping =aes(x = x, y = y)) +geom_bar(stat ="identity") +scale_y_discrete(labels =function(labels) latex2exp::TeX(labels))
4.2 GGplot2 Graphs in LaTeX
font_size <-20font_family <-"serif"#' Theme for ggplot2#'#' @param ... Arguments passed to the theme function.#' @export#' @importFrom ggplot2 element_rect element_text element_blank element_line unit#' rel theme#'theme_paper <-function (...) {theme(text =element_text(family = font_family),plot.background =element_rect(fill ="transparent", color =NA),panel.background =element_rect(fill ="transparent", color =NA),# panel.border = element_rect(fill = NA, colour = "black", linewidth = 1),panel.border =element_blank(),axis.line =element_line(color ="black"),axis.text =element_text(color ="black"),axis.title =element_text(color ="black", size =rel(.8)),legend.text =element_text(size =rel(1)),legend.title =element_text(size =rel(1)),legend.background =element_rect(fill ="transparent", color =NULL),# legend.position = "bottom",# legend.direction = "horizontal",# legend.box = "vertical",legend.key =element_blank(),panel.spacing =unit(1, "lines"),panel.grid.major =element_line(colour ="grey90"),panel.grid.minor =element_blank(),plot.title =element_text(hjust =0, size =rel(.8), face ="bold"),plot.title.position ="plot",plot.margin =unit(c(1, 1, 1, 1), "lines"),strip.background =element_rect(fill =NA, colour =NA),strip.text =element_text(size =rel(.8)) )}theme_ggtern_paper <-function(...) { font_family <-"CMU Serif" font_size <-20theme(strip.background =element_rect(colour ="black", fill =NA),strip.text.x =element_text(colour ="black"),strip.text = ggtext::element_markdown(),text =element_text(family = font_family, size =unit(font_size, "pt")),axis.title =element_text(size =rel(.8)),tern.axis.arrow.show =TRUE,tern.axis.arrow.sep = .13,tern.axis.vshift = .05,panel.border =element_rect(colour =NA) )}#' From plot created with {tikzDevice}, create a standalone latex document#' and compile it with pdflatex to save the plot as pdf#' #' @param filename Name of the tex file (WITHOUT THE EXTENSION) that contains #' the tikzpicture.#' @param path_to_latex Path to LaTeX engine (Defaults to#' `/Library/TeX/texbin/`).#' @param interpreter By default, use pdflatex (`pdflatex`).#' @param path Path to the destination folder.#' @param keep_tex should the tex file (only the one from the standalone doc) #' be kept after compilation? Defaults to `FALSE`.#' @param verbose A logical value indicating whether diagnostic messages are#' printed when measuring dimensions of strings. Defaults to `FALSE`.#' @param ignore.stdout A logical (not NA) indicating whether messages written#' to ‘stdout’ should be ignored. Defaults to `TRUE`.#' @param crop If `TRUE` (default to `FALSE`), the PDF is cropped using pdfcrop.#' plot_to_pdf <-function(filename,path_to_latex ="/Library/TeX/texbin/",interpreter ="pdflatex",path ="./",keep_tex =FALSE,verbose =FALSE,ignore.stdout =TRUE,crop =FALSE) { content <-paste0("\\documentclass{standalone}\\usepackage{amsmath,amssymb,amsthm,mathtools,graphicx}\\usepackage{array,dcolumn}\\usepackage{tikz}\\usetikzlibrary{arrows.meta, positioning, calc} %\\usepackage{dsfont} %\\usepackage{fontspec}\\renewcommand{\\familydefault}{\\rmdefault} %\\usepackage{natbib}\\usepackage{microtype} %\\usepackage{newtxtext,newtxmath} %\\usepackage{times,mathpazo}\\usepackage{pgfplots}\\usetikzlibrary{pgfplots.groupplots}\\usepackage{xcolor}\\begin{document}\\input{", path, filename,".tex}\\end{document}" )# The file which will import the graph in tex format fileConn <-file(paste0(path, filename, "_tmp.tex"))writeLines(content, fileConn)close(fileConn)# Process tex file to get the PDFsystem(paste0( path_to_latex, interpreter, " -shell-escape -synctex=1 -interaction=nonstopmode ", path, filename, "_tmp.tex"),ignore.stdout =TRUE )if (crop ==TRUE) {system(paste0("pdfcrop ", filename, "_tmp.pdf ", filename, "_tmp.pdf" ) ) }if(!path %in%c(".", "./", "/")) system(paste0("mv ", filename, "_tmp.pdf ", path))system(paste0("rm ", filename, "_tmp.aux"))system(paste0("rm ", filename, "_tmp.log"))system(paste0("rm ", filename, "_tmp.synctex.gz"))if (!keep_tex) {system(paste0("rm ", path, filename, "_tmp.tex")) }system(paste0("mv ", path, filename, "_tmp.pdf ", path, filename, ".pdf"))}#' Save a ggplot2 plot as PDF, using LaTeX tikz#'#' @param plot A ggplot2 object.#' @param path_to_latex Path to LaTeX engine (Defaults to#' `/Library/TeX/texbin/`).#' @param interpreter By default, use pdflatex (`pdflatex`).#' @param path Path to the destination folder.#' @param filename File name (without the extension).#' @param keep_tex should the tex file be kept after compilation? Defaults to#' `FALSE`.#' @param width Width in inches (default to 15).#' @param height Height in inches (default to 15).#' @param verbose A logical value indicating whether diagnostic messages are#' printed when measuring dimensions of strings. Defaults to `FALSE`.#' @param ignore.stdout A logical (not NA) indicating whether messages written#' to ‘stdout’ should be ignored. Defaults to `TRUE`.#' @param crop If `TRUE` (default to `FALSE`), the PDF is cropped using pdfcrop.#'#' @importFrom tikzDevice tikz#' @importFrom grDevices dev.off#' @export#' @md#'ggplot2_to_pdf <-function(plot,path_to_latex ="/Library/TeX/texbin/",interpreter ="pdflatex",path ="./", filename,keep_tex =FALSE,width =15,height =15,verbose =FALSE,ignore.stdout =TRUE,crop =FALSE) { content <-paste0("\\documentclass{standalone}\\usepackage{amsmath,amssymb,amsthm,mathtools,graphicx}\\usepackage{array,dcolumn} %\\usepackage{dsfont} %\\usepackage{fontspec} %\\setmainfont{Noto Sans} %\\usepackage{tikz}\\usetikzlibrary{arrows.meta, positioning, calc}\\usepackage{nicefrac} %\\usepackage{natbib}\\usepackage{microtype} %\\usepackage{newtxtext,newtxmath} %\\usepackage{times,mathpazo}\\usepackage{pgfplots}\\usetikzlibrary{pgfplots.groupplots}\\usepackage{xcolor}\\renewcommand{\\familydefault}{\\rmdefault}\\begin{document}\\input{", path, filename,"_content.tex}\\end{document}" )# The file which will import the graph in tex format fileConn <-file(paste0(path, filename, ".tex"))writeLines(content, fileConn)close(fileConn)# Export graph to textikz(file =paste0( path, filename, "_content.tex"),width = width,height = height,verbose = verbose )print(plot)dev.off()# Move the scale from ggplot, if any name_scale <-paste0(filename, "_content_ras1.png") scale_exists <-file.exists(name_scale)if (scale_exists &! path %in%c(".", "./", "/")) {system(paste0("mv ", name_scale, " ", path)) }# Process tex file to get the PDFsystem(paste0( path_to_latex, interpreter, " -shell-escape -synctex=1 -interaction=nonstopmode ", path, filename, ".tex"),ignore.stdout =TRUE )if (crop ==TRUE) {system(paste0("pdfcrop ", path, filename, ".pdf ", path, filename, ".pdf")) }if(!path %in%c(".", "./", "/")) system(paste0("mv ", filename, ".pdf ", path))system(paste0("rm ", filename, ".aux"))system(paste0("rm ", filename, ".log"))system(paste0("rm ", filename, ".synctex.gz"))if (!keep_tex) {system(paste0("rm ", path, filename, ".tex"))system(paste0("rm ", path, filename, "_content.tex")) }if (scale_exists) system(paste0("rm ", path, "/", name_scale))}